Immigrants from Norway vs African Householder Income Ages 45 - 64 years
COMPARE
Immigrants from Norway
African
Householder Income Ages 45 - 64 years
Householder Income Ages 45 - 64 years Comparison
Immigrants from Norway
Africans
$111,669
HOUSEHOLDER INCOME AGES 45 - 64 YEARS
99.7/ 100
METRIC RATING
62nd/ 347
METRIC RANK
$84,925
HOUSEHOLDER INCOME AGES 45 - 64 YEARS
0.0/ 100
METRIC RATING
298th/ 347
METRIC RANK
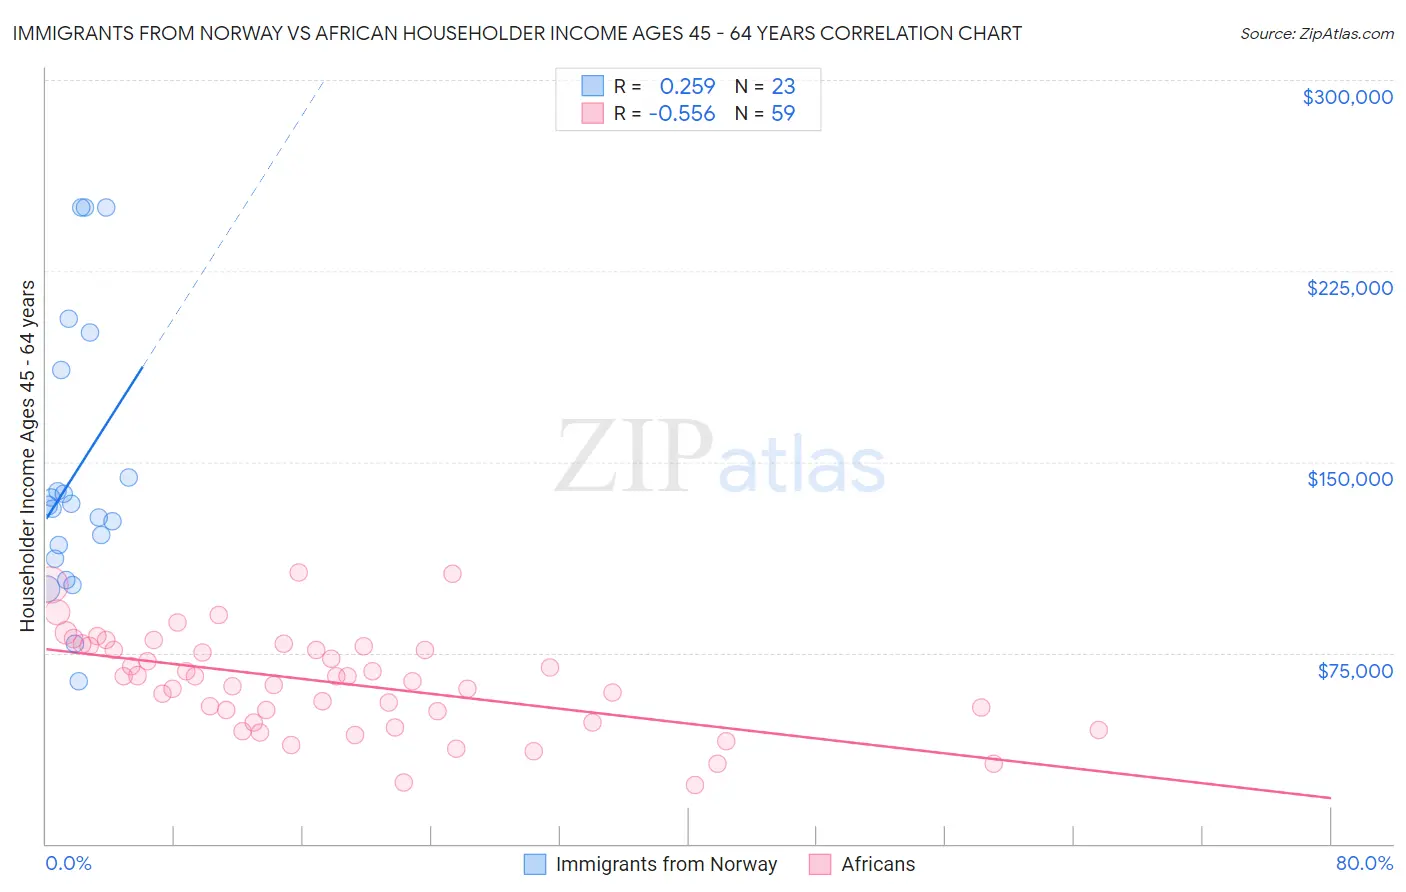
Immigrants from Norway vs African Householder Income Ages 45 - 64 years Correlation Chart
The statistical analysis conducted on geographies consisting of 116,657,782 people shows a weak positive correlation between the proportion of Immigrants from Norway and household income with householder between the ages 45 and 64 in the United States with a correlation coefficient (R) of 0.259 and weighted average of $111,669. Similarly, the statistical analysis conducted on geographies consisting of 468,468,488 people shows a substantial negative correlation between the proportion of Africans and household income with householder between the ages 45 and 64 in the United States with a correlation coefficient (R) of -0.556 and weighted average of $84,925, a difference of 31.5%.
Householder Income Ages 45 - 64 years Correlation Summary
| Measurement | Immigrants from Norway | African |
| Minimum | $63,891 | $23,133 |
| Maximum | $250,001 | $106,630 |
| Range | $186,110 | $83,497 |
| Mean | $145,670 | $63,321 |
| Median | $132,825 | $65,668 |
| Interquartile 25% (IQ1) | $111,854 | $47,695 |
| Interquartile 75% (IQ3) | $186,082 | $77,568 |
| Interquartile Range (IQR) | $74,228 | $29,873 |
| Standard Deviation (Sample) | $53,028 | $19,169 |
| Standard Deviation (Population) | $51,863 | $19,006 |
Similar Demographics by Householder Income Ages 45 - 64 years
Demographics Similar to Immigrants from Norway by Householder Income Ages 45 - 64 years
In terms of householder income ages 45 - 64 years, the demographic groups most similar to Immigrants from Norway are Mongolian ($111,602, a difference of 0.060%), Immigrants from Latvia ($111,454, a difference of 0.19%), Immigrants from Belarus ($111,430, a difference of 0.21%), Immigrants from Czechoslovakia ($111,914, a difference of 0.22%), and Immigrants from Europe ($111,984, a difference of 0.28%).
| Demographics | Rating | Rank | Householder Income Ages 45 - 64 years |
| Lithuanians | 99.8 /100 | #55 | Exceptional $112,484 |
| Egyptians | 99.7 /100 | #56 | Exceptional $112,256 |
| Immigrants | Scotland | 99.7 /100 | #57 | Exceptional $112,175 |
| Soviet Union | 99.7 /100 | #58 | Exceptional $112,008 |
| Immigrants | Europe | 99.7 /100 | #59 | Exceptional $111,984 |
| Immigrants | Netherlands | 99.7 /100 | #60 | Exceptional $111,982 |
| Immigrants | Czechoslovakia | 99.7 /100 | #61 | Exceptional $111,914 |
| Immigrants | Norway | 99.7 /100 | #62 | Exceptional $111,669 |
| Mongolians | 99.6 /100 | #63 | Exceptional $111,602 |
| Immigrants | Latvia | 99.6 /100 | #64 | Exceptional $111,454 |
| Immigrants | Belarus | 99.6 /100 | #65 | Exceptional $111,430 |
| New Zealanders | 99.6 /100 | #66 | Exceptional $111,286 |
| Laotians | 99.5 /100 | #67 | Exceptional $111,051 |
| Immigrants | Romania | 99.4 /100 | #68 | Exceptional $110,633 |
| Immigrants | Italy | 99.4 /100 | #69 | Exceptional $110,434 |
Demographics Similar to Africans by Householder Income Ages 45 - 64 years
In terms of householder income ages 45 - 64 years, the demographic groups most similar to Africans are Immigrants from Mexico ($84,910, a difference of 0.020%), Indonesian ($84,890, a difference of 0.040%), Fijian ($85,187, a difference of 0.31%), Immigrants from Zaire ($85,207, a difference of 0.33%), and Potawatomi ($84,613, a difference of 0.37%).
| Demographics | Rating | Rank | Householder Income Ages 45 - 64 years |
| Hispanics or Latinos | 0.1 /100 | #291 | Tragic $86,006 |
| Immigrants | Central America | 0.1 /100 | #292 | Tragic $85,965 |
| Comanche | 0.1 /100 | #293 | Tragic $85,787 |
| British West Indians | 0.1 /100 | #294 | Tragic $85,571 |
| Immigrants | Grenada | 0.1 /100 | #295 | Tragic $85,552 |
| Immigrants | Zaire | 0.1 /100 | #296 | Tragic $85,207 |
| Fijians | 0.1 /100 | #297 | Tragic $85,187 |
| Africans | 0.0 /100 | #298 | Tragic $84,925 |
| Immigrants | Mexico | 0.0 /100 | #299 | Tragic $84,910 |
| Indonesians | 0.0 /100 | #300 | Tragic $84,890 |
| Potawatomi | 0.0 /100 | #301 | Tragic $84,613 |
| Haitians | 0.0 /100 | #302 | Tragic $84,384 |
| Hondurans | 0.0 /100 | #303 | Tragic $84,079 |
| Ottawa | 0.0 /100 | #304 | Tragic $83,953 |
| Chippewa | 0.0 /100 | #305 | Tragic $83,943 |