Immigrants from Norway vs Immigrants from Northern Africa Householder Income Ages 25 - 44 years
COMPARE
Immigrants from Norway
Immigrants from Northern Africa
Householder Income Ages 25 - 44 years
Householder Income Ages 25 - 44 years Comparison
Immigrants from Norway
Immigrants from Northern Africa
$106,629
HOUSEHOLDER INCOME AGES 25 - 44 YEARS
99.9/ 100
METRIC RATING
53rd/ 347
METRIC RANK
$99,232
HOUSEHOLDER INCOME AGES 25 - 44 YEARS
93.0/ 100
METRIC RATING
117th/ 347
METRIC RANK
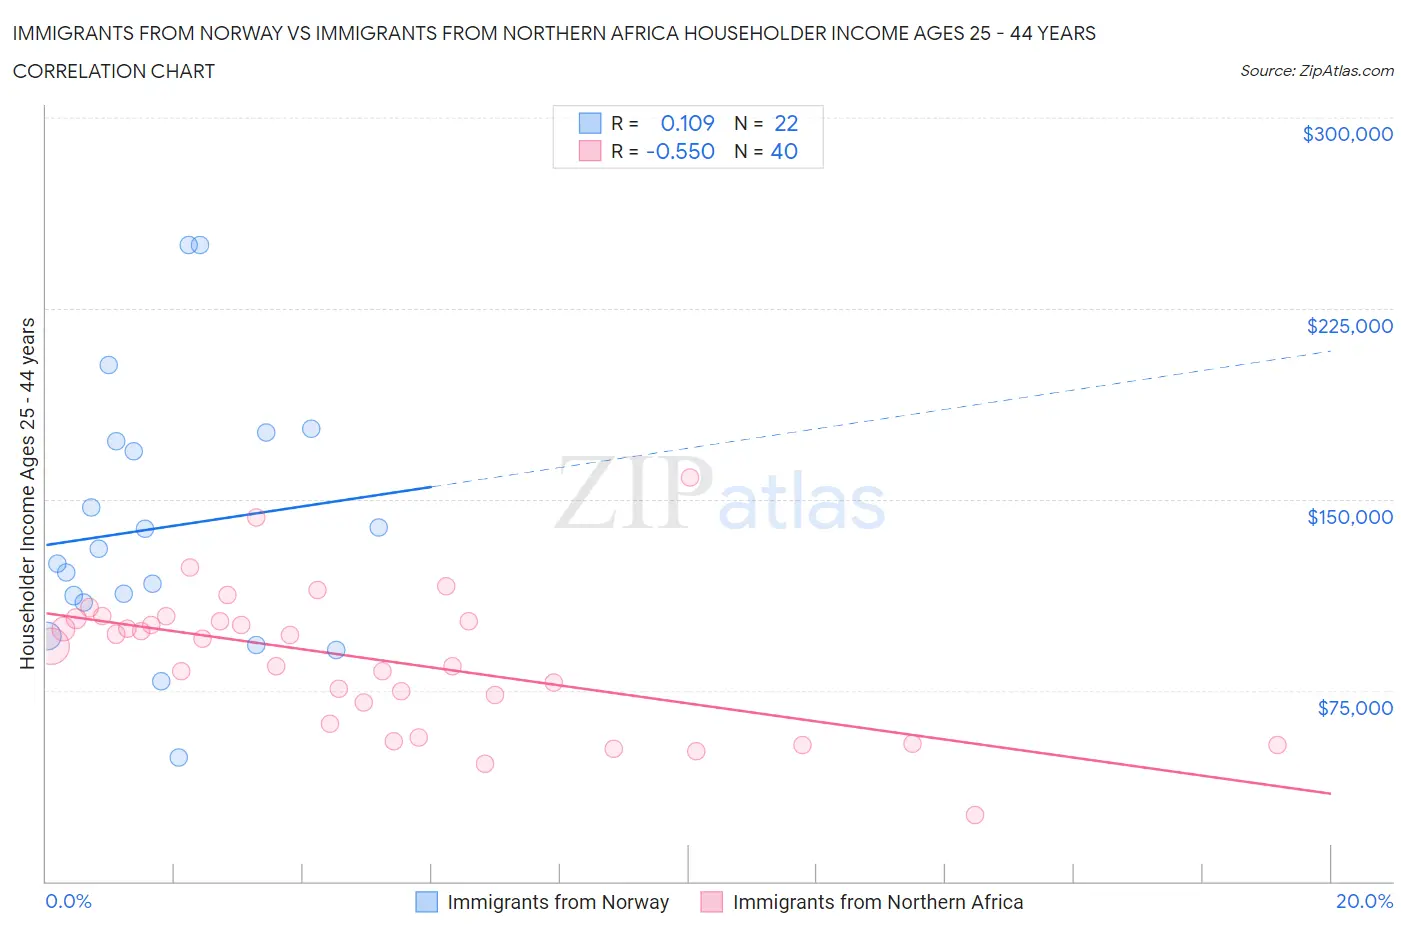
Immigrants from Norway vs Immigrants from Northern Africa Householder Income Ages 25 - 44 years Correlation Chart
The statistical analysis conducted on geographies consisting of 116,548,648 people shows a poor positive correlation between the proportion of Immigrants from Norway and household income with householder between the ages 25 and 44 in the United States with a correlation coefficient (R) of 0.109 and weighted average of $106,629. Similarly, the statistical analysis conducted on geographies consisting of 320,605,097 people shows a substantial negative correlation between the proportion of Immigrants from Northern Africa and household income with householder between the ages 25 and 44 in the United States with a correlation coefficient (R) of -0.550 and weighted average of $99,232, a difference of 7.4%.
Householder Income Ages 25 - 44 years Correlation Summary
| Measurement | Immigrants from Norway | Immigrants from Northern Africa |
| Minimum | $48,750 | $26,250 |
| Maximum | $250,001 | $158,487 |
| Range | $201,251 | $132,237 |
| Mean | $138,956 | $87,149 |
| Median | $127,644 | $93,767 |
| Interquartile 25% (IQ1) | $109,255 | $65,886 |
| Interquartile 75% (IQ3) | $172,615 | $102,671 |
| Interquartile Range (IQR) | $63,360 | $36,785 |
| Standard Deviation (Sample) | $51,236 | $27,415 |
| Standard Deviation (Population) | $50,058 | $27,070 |
Similar Demographics by Householder Income Ages 25 - 44 years
Demographics Similar to Immigrants from Norway by Householder Income Ages 25 - 44 years
In terms of householder income ages 25 - 44 years, the demographic groups most similar to Immigrants from Norway are Paraguayan ($106,615, a difference of 0.010%), Greek ($106,457, a difference of 0.16%), Immigrants from Europe ($106,817, a difference of 0.18%), Immigrants from Czechoslovakia ($106,888, a difference of 0.24%), and Immigrants from Pakistan ($106,129, a difference of 0.47%).
| Demographics | Rating | Rank | Householder Income Ages 25 - 44 years |
| Immigrants | Belarus | 99.9 /100 | #46 | Exceptional $107,393 |
| Estonians | 99.9 /100 | #47 | Exceptional $107,269 |
| Bulgarians | 99.9 /100 | #48 | Exceptional $107,264 |
| Immigrants | Turkey | 99.9 /100 | #49 | Exceptional $107,258 |
| Cambodians | 99.9 /100 | #50 | Exceptional $107,148 |
| Immigrants | Czechoslovakia | 99.9 /100 | #51 | Exceptional $106,888 |
| Immigrants | Europe | 99.9 /100 | #52 | Exceptional $106,817 |
| Immigrants | Norway | 99.9 /100 | #53 | Exceptional $106,629 |
| Paraguayans | 99.9 /100 | #54 | Exceptional $106,615 |
| Greeks | 99.9 /100 | #55 | Exceptional $106,457 |
| Immigrants | Pakistan | 99.8 /100 | #56 | Exceptional $106,129 |
| Immigrants | Austria | 99.8 /100 | #57 | Exceptional $106,103 |
| Immigrants | South Africa | 99.8 /100 | #58 | Exceptional $105,748 |
| Immigrants | Latvia | 99.8 /100 | #59 | Exceptional $105,522 |
| Egyptians | 99.7 /100 | #60 | Exceptional $105,282 |
Demographics Similar to Immigrants from Northern Africa by Householder Income Ages 25 - 44 years
In terms of householder income ages 25 - 44 years, the demographic groups most similar to Immigrants from Northern Africa are Syrian ($99,215, a difference of 0.020%), Jordanian ($99,186, a difference of 0.050%), Swedish ($99,136, a difference of 0.10%), Portuguese ($99,429, a difference of 0.20%), and Carpatho Rusyn ($99,449, a difference of 0.22%).
| Demographics | Rating | Rank | Householder Income Ages 25 - 44 years |
| Immigrants | Afghanistan | 95.3 /100 | #110 | Exceptional $99,977 |
| Chileans | 95.1 /100 | #111 | Exceptional $99,900 |
| Poles | 94.5 /100 | #112 | Exceptional $99,685 |
| Tongans | 94.2 /100 | #113 | Exceptional $99,604 |
| Immigrants | Western Asia | 94.0 /100 | #114 | Exceptional $99,516 |
| Carpatho Rusyns | 93.7 /100 | #115 | Exceptional $99,449 |
| Portuguese | 93.7 /100 | #116 | Exceptional $99,429 |
| Immigrants | Northern Africa | 93.0 /100 | #117 | Exceptional $99,232 |
| Syrians | 92.9 /100 | #118 | Exceptional $99,215 |
| Jordanians | 92.8 /100 | #119 | Exceptional $99,186 |
| Swedes | 92.7 /100 | #120 | Exceptional $99,136 |
| Peruvians | 91.7 /100 | #121 | Exceptional $98,886 |
| Immigrants | Uzbekistan | 91.5 /100 | #122 | Exceptional $98,849 |
| Palestinians | 91.2 /100 | #123 | Exceptional $98,777 |
| Zimbabweans | 90.3 /100 | #124 | Exceptional $98,586 |