Immigrants from Northern Europe vs Immigrants from Jordan Householder Income Under 25 years
COMPARE
Immigrants from Northern Europe
Immigrants from Jordan
Householder Income Under 25 years
Householder Income Under 25 years Comparison
Immigrants from Northern Europe
Immigrants from Jordan
$54,571
HOUSEHOLDER INCOME UNDER 25 YEARS
99.7/ 100
METRIC RATING
72nd/ 347
METRIC RANK
$51,370
HOUSEHOLDER INCOME UNDER 25 YEARS
11.9/ 100
METRIC RATING
208th/ 347
METRIC RANK
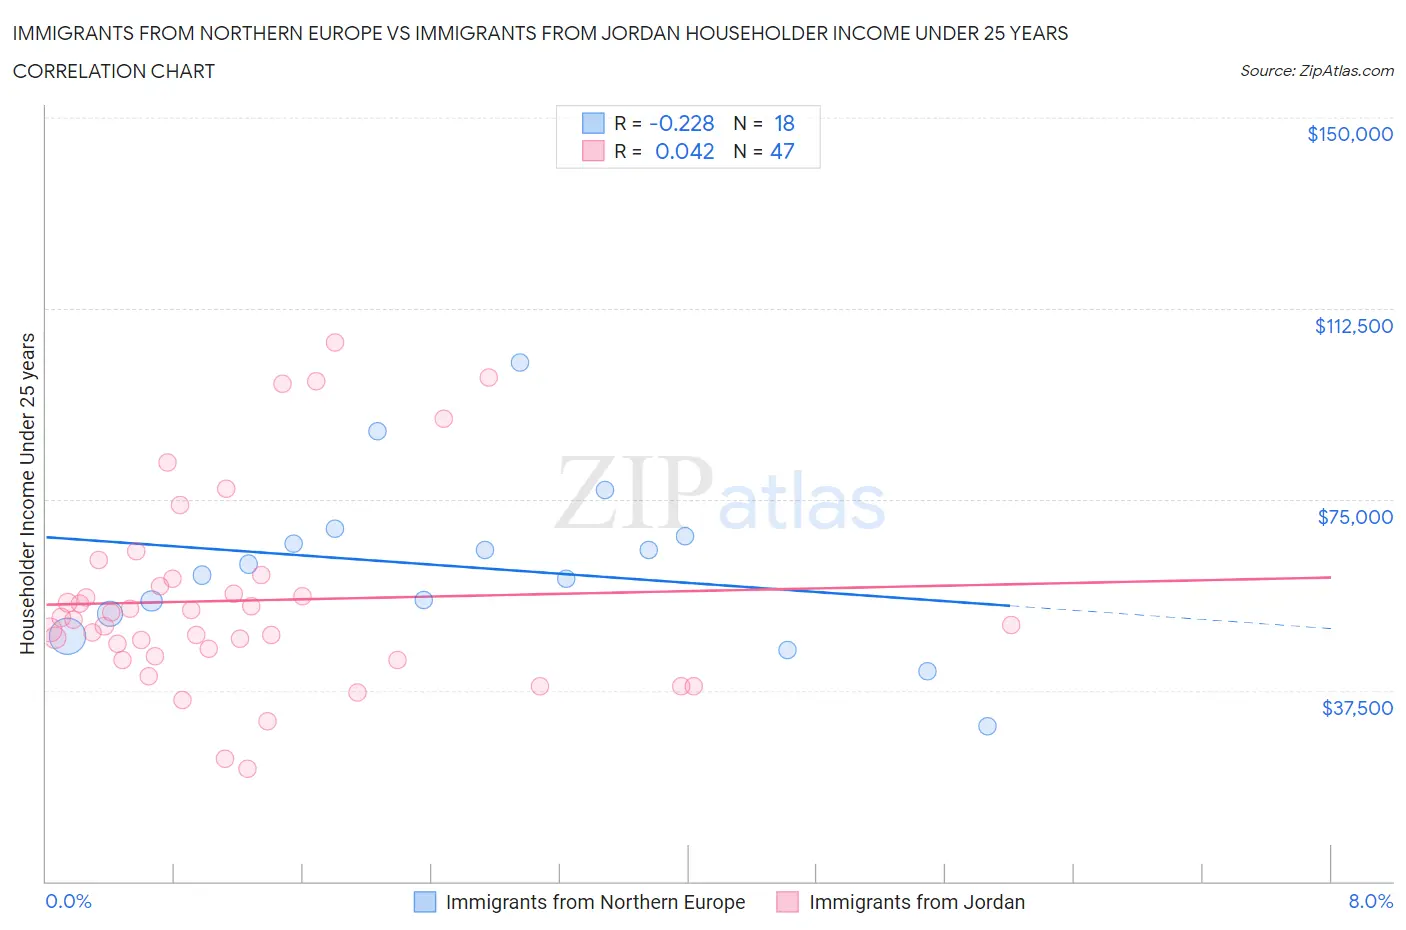
Immigrants from Northern Europe vs Immigrants from Jordan Householder Income Under 25 years Correlation Chart
The statistical analysis conducted on geographies consisting of 387,569,544 people shows a weak negative correlation between the proportion of Immigrants from Northern Europe and household income with householder under the age of 25 in the United States with a correlation coefficient (R) of -0.228 and weighted average of $54,571. Similarly, the statistical analysis conducted on geographies consisting of 163,486,233 people shows no correlation between the proportion of Immigrants from Jordan and household income with householder under the age of 25 in the United States with a correlation coefficient (R) of 0.042 and weighted average of $51,370, a difference of 6.2%.
Householder Income Under 25 years Correlation Summary
| Measurement | Immigrants from Northern Europe | Immigrants from Jordan |
| Minimum | $30,455 | $22,102 |
| Maximum | $101,975 | $105,714 |
| Range | $71,520 | $83,612 |
| Mean | $61,689 | $55,122 |
| Median | $61,171 | $51,314 |
| Interquartile 25% (IQ1) | $52,438 | $44,180 |
| Interquartile 75% (IQ3) | $67,748 | $59,421 |
| Interquartile Range (IQR) | $15,310 | $15,241 |
| Standard Deviation (Sample) | $16,674 | $18,968 |
| Standard Deviation (Population) | $16,204 | $18,765 |
Similar Demographics by Householder Income Under 25 years
Demographics Similar to Immigrants from Northern Europe by Householder Income Under 25 years
In terms of householder income under 25 years, the demographic groups most similar to Immigrants from Northern Europe are Macedonian ($54,563, a difference of 0.020%), Immigrants from Morocco ($54,593, a difference of 0.040%), Immigrants from El Salvador ($54,599, a difference of 0.050%), Immigrants from Grenada ($54,538, a difference of 0.060%), and Samoan ($54,610, a difference of 0.070%).
| Demographics | Rating | Rank | Householder Income Under 25 years |
| Yup'ik | 99.8 /100 | #65 | Exceptional $54,732 |
| Immigrants | Bangladesh | 99.8 /100 | #66 | Exceptional $54,714 |
| Okinawans | 99.8 /100 | #67 | Exceptional $54,701 |
| Tsimshian | 99.8 /100 | #68 | Exceptional $54,649 |
| Samoans | 99.7 /100 | #69 | Exceptional $54,610 |
| Immigrants | El Salvador | 99.7 /100 | #70 | Exceptional $54,599 |
| Immigrants | Morocco | 99.7 /100 | #71 | Exceptional $54,593 |
| Immigrants | Northern Europe | 99.7 /100 | #72 | Exceptional $54,571 |
| Macedonians | 99.7 /100 | #73 | Exceptional $54,563 |
| Immigrants | Grenada | 99.7 /100 | #74 | Exceptional $54,538 |
| Immigrants | Sri Lanka | 99.7 /100 | #75 | Exceptional $54,512 |
| Immigrants | Brazil | 99.6 /100 | #76 | Exceptional $54,487 |
| Immigrants | Southern Europe | 99.6 /100 | #77 | Exceptional $54,484 |
| Nepalese | 99.6 /100 | #78 | Exceptional $54,472 |
| Immigrants | Italy | 99.6 /100 | #79 | Exceptional $54,449 |
Demographics Similar to Immigrants from Jordan by Householder Income Under 25 years
In terms of householder income under 25 years, the demographic groups most similar to Immigrants from Jordan are South African ($51,383, a difference of 0.020%), Cape Verdean ($51,387, a difference of 0.030%), Immigrants from Latin America ($51,387, a difference of 0.030%), Syrian ($51,353, a difference of 0.030%), and Immigrants from Ghana ($51,333, a difference of 0.070%).
| Demographics | Rating | Rank | Householder Income Under 25 years |
| British | 14.9 /100 | #201 | Poor $51,477 |
| Immigrants | Guatemala | 14.0 /100 | #202 | Poor $51,447 |
| Immigrants | Cameroon | 13.6 /100 | #203 | Poor $51,433 |
| Czechs | 13.2 /100 | #204 | Poor $51,421 |
| Cape Verdeans | 12.3 /100 | #205 | Poor $51,387 |
| Immigrants | Latin America | 12.3 /100 | #206 | Poor $51,387 |
| South Africans | 12.2 /100 | #207 | Poor $51,383 |
| Immigrants | Jordan | 11.9 /100 | #208 | Poor $51,370 |
| Syrians | 11.4 /100 | #209 | Poor $51,353 |
| Immigrants | Ghana | 10.9 /100 | #210 | Poor $51,333 |
| Irish | 10.6 /100 | #211 | Poor $51,317 |
| Immigrants | Panama | 9.7 /100 | #212 | Tragic $51,278 |
| Dutch | 9.4 /100 | #213 | Tragic $51,265 |
| Zimbabweans | 9.3 /100 | #214 | Tragic $51,259 |
| Icelanders | 9.1 /100 | #215 | Tragic $51,247 |