Immigrants from Northern Europe vs Alsatian Householder Income Ages 45 - 64 years
COMPARE
Immigrants from Northern Europe
Alsatian
Householder Income Ages 45 - 64 years
Householder Income Ages 45 - 64 years Comparison
Immigrants from Northern Europe
Alsatians
$117,930
HOUSEHOLDER INCOME AGES 45 - 64 YEARS
100.0/ 100
METRIC RATING
27th/ 347
METRIC RANK
$100,435
HOUSEHOLDER INCOME AGES 45 - 64 YEARS
51.4/ 100
METRIC RATING
173rd/ 347
METRIC RANK
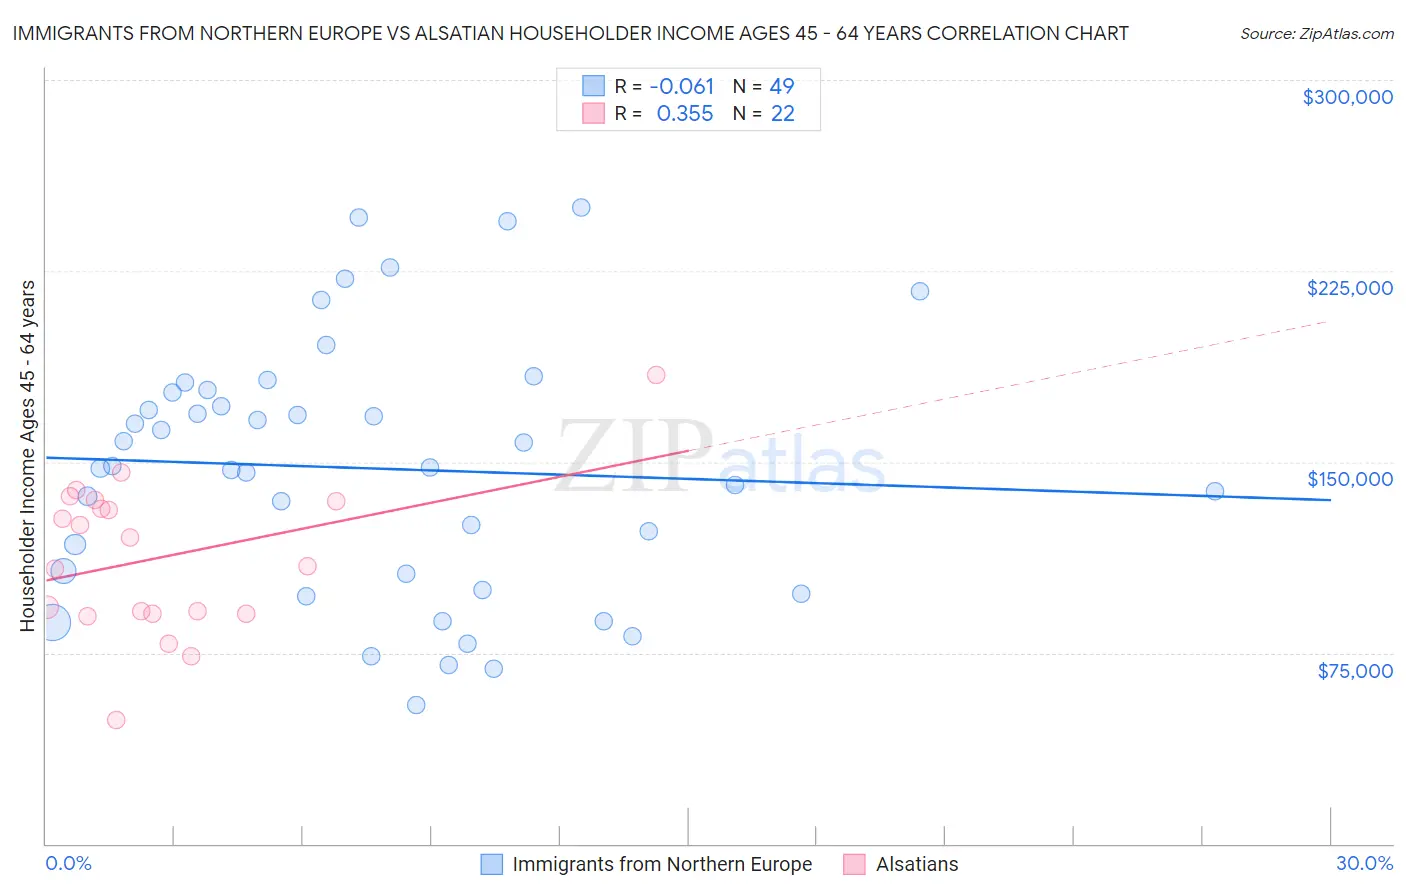
Immigrants from Northern Europe vs Alsatian Householder Income Ages 45 - 64 years Correlation Chart
The statistical analysis conducted on geographies consisting of 476,061,115 people shows a slight negative correlation between the proportion of Immigrants from Northern Europe and household income with householder between the ages 45 and 64 in the United States with a correlation coefficient (R) of -0.061 and weighted average of $117,930. Similarly, the statistical analysis conducted on geographies consisting of 82,661,679 people shows a mild positive correlation between the proportion of Alsatians and household income with householder between the ages 45 and 64 in the United States with a correlation coefficient (R) of 0.355 and weighted average of $100,435, a difference of 17.4%.
Householder Income Ages 45 - 64 years Correlation Summary
| Measurement | Immigrants from Northern Europe | Alsatian |
| Minimum | $54,375 | $48,731 |
| Maximum | $250,001 | $184,018 |
| Range | $195,626 | $135,287 |
| Mean | $147,439 | $112,529 |
| Median | $147,652 | $114,674 |
| Interquartile 25% (IQ1) | $102,957 | $90,588 |
| Interquartile 75% (IQ3) | $177,734 | $134,688 |
| Interquartile Range (IQR) | $74,777 | $44,100 |
| Standard Deviation (Sample) | $50,256 | $30,232 |
| Standard Deviation (Population) | $49,741 | $29,537 |
Similar Demographics by Householder Income Ages 45 - 64 years
Demographics Similar to Immigrants from Northern Europe by Householder Income Ages 45 - 64 years
In terms of householder income ages 45 - 64 years, the demographic groups most similar to Immigrants from Northern Europe are Turkish ($117,814, a difference of 0.10%), Bhutanese ($117,750, a difference of 0.15%), Immigrants from Bolivia ($117,731, a difference of 0.17%), Immigrants from Sweden ($118,318, a difference of 0.33%), and Asian ($118,426, a difference of 0.42%).
| Demographics | Rating | Rank | Householder Income Ages 45 - 64 years |
| Immigrants | Australia | 100.0 /100 | #20 | Exceptional $119,308 |
| Immigrants | Sri Lanka | 100.0 /100 | #21 | Exceptional $119,094 |
| Immigrants | Belgium | 100.0 /100 | #22 | Exceptional $118,932 |
| Bolivians | 100.0 /100 | #23 | Exceptional $118,871 |
| Immigrants | Japan | 100.0 /100 | #24 | Exceptional $118,498 |
| Asians | 100.0 /100 | #25 | Exceptional $118,426 |
| Immigrants | Sweden | 100.0 /100 | #26 | Exceptional $118,318 |
| Immigrants | Northern Europe | 100.0 /100 | #27 | Exceptional $117,930 |
| Turks | 100.0 /100 | #28 | Exceptional $117,814 |
| Bhutanese | 100.0 /100 | #29 | Exceptional $117,750 |
| Immigrants | Bolivia | 100.0 /100 | #30 | Exceptional $117,731 |
| Immigrants | Asia | 100.0 /100 | #31 | Exceptional $116,566 |
| Russians | 100.0 /100 | #32 | Exceptional $116,328 |
| Chinese | 100.0 /100 | #33 | Exceptional $116,156 |
| Immigrants | Denmark | 100.0 /100 | #34 | Exceptional $116,000 |
Demographics Similar to Alsatians by Householder Income Ages 45 - 64 years
In terms of householder income ages 45 - 64 years, the demographic groups most similar to Alsatians are Immigrants from Uzbekistan ($100,523, a difference of 0.090%), Welsh ($100,322, a difference of 0.11%), German ($100,224, a difference of 0.21%), Immigrants from Costa Rica ($100,141, a difference of 0.29%), and Moroccan ($100,138, a difference of 0.30%).
| Demographics | Rating | Rank | Householder Income Ages 45 - 64 years |
| Samoans | 65.3 /100 | #166 | Good $101,580 |
| Czechoslovakians | 63.0 /100 | #167 | Good $101,387 |
| South American Indians | 60.5 /100 | #168 | Good $101,171 |
| Guamanians/Chamorros | 60.5 /100 | #169 | Good $101,170 |
| Slovaks | 58.8 /100 | #170 | Average $101,029 |
| South Americans | 56.4 /100 | #171 | Average $100,837 |
| Immigrants | Uzbekistan | 52.5 /100 | #172 | Average $100,523 |
| Alsatians | 51.4 /100 | #173 | Average $100,435 |
| Welsh | 50.0 /100 | #174 | Average $100,322 |
| Germans | 48.8 /100 | #175 | Average $100,224 |
| Immigrants | Costa Rica | 47.7 /100 | #176 | Average $100,141 |
| Moroccans | 47.7 /100 | #177 | Average $100,138 |
| Immigrants | Cameroon | 47.0 /100 | #178 | Average $100,084 |
| Belgians | 46.7 /100 | #179 | Average $100,060 |
| Aleuts | 46.6 /100 | #180 | Average $100,052 |