Immigrants from Northern Africa vs Navajo Median Male Earnings
COMPARE
Immigrants from Northern Africa
Navajo
Median Male Earnings
Median Male Earnings Comparison
Immigrants from Northern Africa
Navajo
$58,008
MEDIAN MALE EARNINGS
96.9/ 100
METRIC RATING
106th/ 347
METRIC RANK
$42,098
MEDIAN MALE EARNINGS
0.0/ 100
METRIC RATING
340th/ 347
METRIC RANK
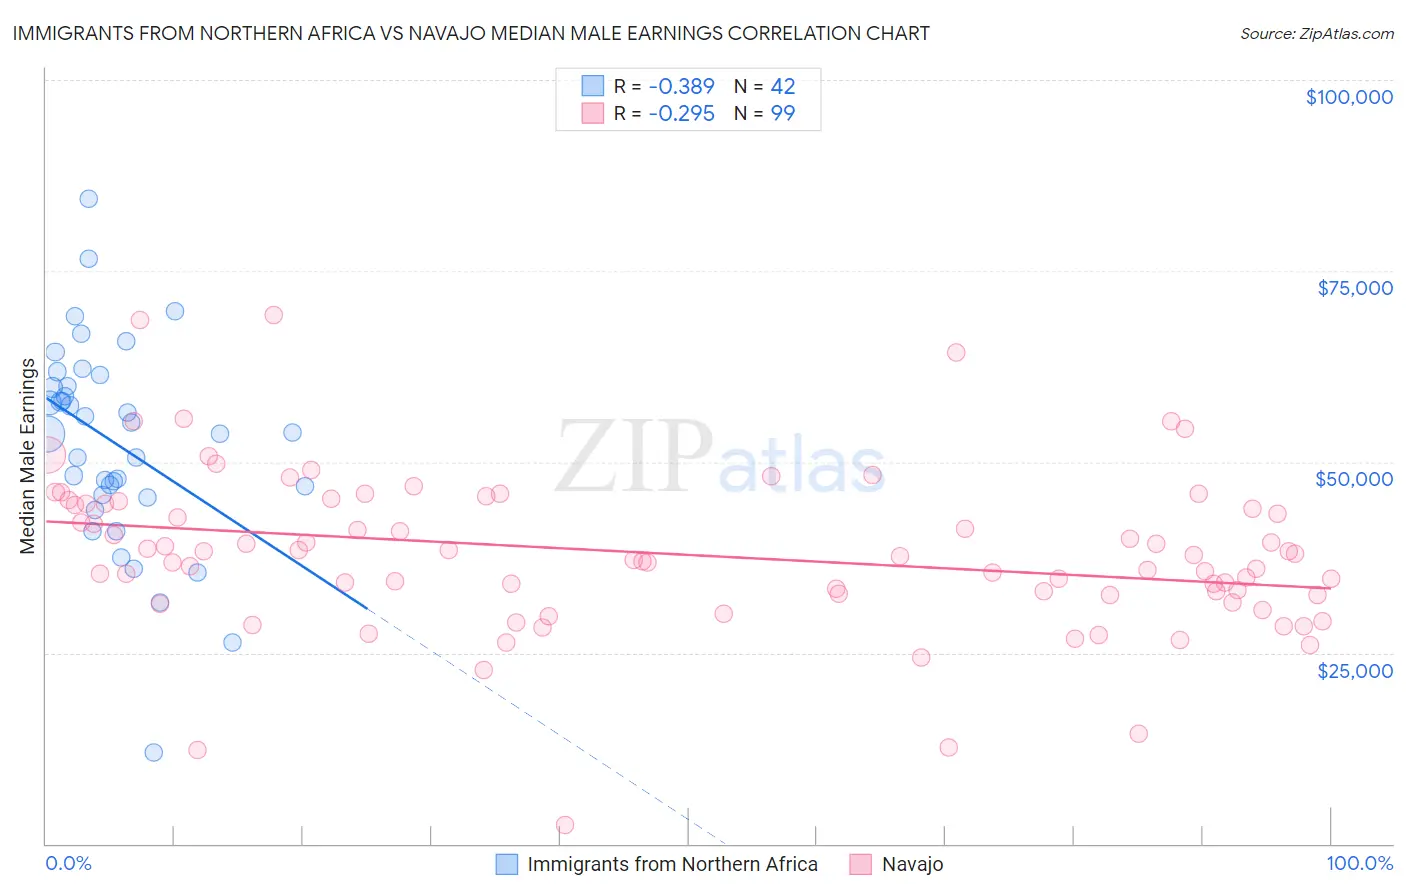
Immigrants from Northern Africa vs Navajo Median Male Earnings Correlation Chart
The statistical analysis conducted on geographies consisting of 321,143,367 people shows a mild negative correlation between the proportion of Immigrants from Northern Africa and median male earnings in the United States with a correlation coefficient (R) of -0.389 and weighted average of $58,008. Similarly, the statistical analysis conducted on geographies consisting of 224,788,234 people shows a weak negative correlation between the proportion of Navajo and median male earnings in the United States with a correlation coefficient (R) of -0.295 and weighted average of $42,098, a difference of 37.8%.
Median Male Earnings Correlation Summary
| Measurement | Immigrants from Northern Africa | Navajo |
| Minimum | $12,000 | $2,499 |
| Maximum | $84,392 | $69,181 |
| Range | $72,392 | $66,682 |
| Mean | $52,417 | $37,941 |
| Median | $53,736 | $37,586 |
| Interquartile 25% (IQ1) | $45,608 | $32,558 |
| Interquartile 75% (IQ3) | $59,910 | $44,589 |
| Interquartile Range (IQR) | $14,302 | $12,031 |
| Standard Deviation (Sample) | $13,421 | $10,577 |
| Standard Deviation (Population) | $13,260 | $10,524 |
Similar Demographics by Median Male Earnings
Demographics Similar to Immigrants from Northern Africa by Median Male Earnings
In terms of median male earnings, the demographic groups most similar to Immigrants from Northern Africa are Serbian ($57,975, a difference of 0.060%), Immigrants from Uzbekistan ($57,941, a difference of 0.12%), British ($57,890, a difference of 0.20%), Immigrants from Western Asia ($58,131, a difference of 0.21%), and Armenian ($58,134, a difference of 0.22%).
| Demographics | Rating | Rank | Median Male Earnings |
| Immigrants | Poland | 98.0 /100 | #99 | Exceptional $58,452 |
| Assyrians/Chaldeans/Syriacs | 97.9 /100 | #100 | Exceptional $58,437 |
| Immigrants | Brazil | 97.7 /100 | #101 | Exceptional $58,324 |
| Syrians | 97.4 /100 | #102 | Exceptional $58,187 |
| Poles | 97.3 /100 | #103 | Exceptional $58,139 |
| Armenians | 97.3 /100 | #104 | Exceptional $58,134 |
| Immigrants | Western Asia | 97.3 /100 | #105 | Exceptional $58,131 |
| Immigrants | Northern Africa | 96.9 /100 | #106 | Exceptional $58,008 |
| Serbians | 96.8 /100 | #107 | Exceptional $57,975 |
| Immigrants | Uzbekistan | 96.7 /100 | #108 | Exceptional $57,941 |
| British | 96.5 /100 | #109 | Exceptional $57,890 |
| Palestinians | 96.2 /100 | #110 | Exceptional $57,778 |
| Europeans | 95.6 /100 | #111 | Exceptional $57,637 |
| Immigrants | Afghanistan | 95.4 /100 | #112 | Exceptional $57,582 |
| Carpatho Rusyns | 95.3 /100 | #113 | Exceptional $57,572 |
Demographics Similar to Navajo by Median Male Earnings
In terms of median male earnings, the demographic groups most similar to Navajo are Hopi ($42,060, a difference of 0.090%), Pima ($42,357, a difference of 0.62%), Crow ($42,434, a difference of 0.80%), Arapaho ($41,758, a difference of 0.81%), and Lumbee ($41,715, a difference of 0.92%).
| Demographics | Rating | Rank | Median Male Earnings |
| Immigrants | Congo | 0.0 /100 | #333 | Tragic $44,204 |
| Immigrants | Yemen | 0.0 /100 | #334 | Tragic $44,083 |
| Spanish American Indians | 0.0 /100 | #335 | Tragic $44,010 |
| Immigrants | Cuba | 0.0 /100 | #336 | Tragic $43,461 |
| Menominee | 0.0 /100 | #337 | Tragic $42,581 |
| Crow | 0.0 /100 | #338 | Tragic $42,434 |
| Pima | 0.0 /100 | #339 | Tragic $42,357 |
| Navajo | 0.0 /100 | #340 | Tragic $42,098 |
| Hopi | 0.0 /100 | #341 | Tragic $42,060 |
| Arapaho | 0.0 /100 | #342 | Tragic $41,758 |
| Lumbee | 0.0 /100 | #343 | Tragic $41,715 |
| Pueblo | 0.0 /100 | #344 | Tragic $41,314 |
| Puerto Ricans | 0.0 /100 | #345 | Tragic $40,071 |
| Tohono O'odham | 0.0 /100 | #346 | Tragic $39,543 |
| Yup'ik | 0.0 /100 | #347 | Tragic $39,504 |