Immigrants from Northern Africa vs Cheyenne Median Male Earnings
COMPARE
Immigrants from Northern Africa
Cheyenne
Median Male Earnings
Median Male Earnings Comparison
Immigrants from Northern Africa
Cheyenne
$58,008
MEDIAN MALE EARNINGS
96.9/ 100
METRIC RATING
106th/ 347
METRIC RANK
$46,062
MEDIAN MALE EARNINGS
0.0/ 100
METRIC RATING
318th/ 347
METRIC RANK
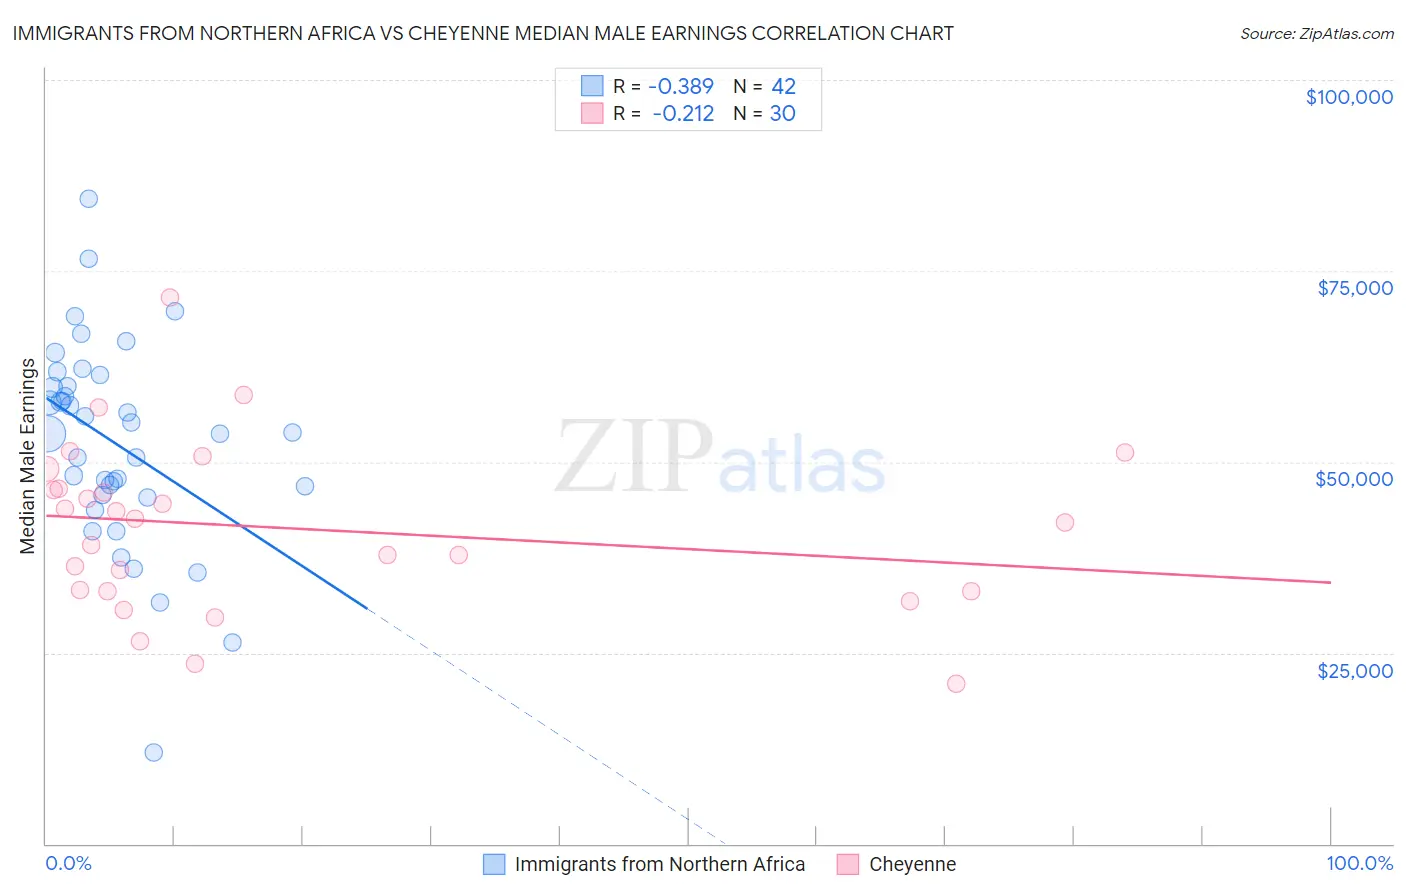
Immigrants from Northern Africa vs Cheyenne Median Male Earnings Correlation Chart
The statistical analysis conducted on geographies consisting of 321,143,367 people shows a mild negative correlation between the proportion of Immigrants from Northern Africa and median male earnings in the United States with a correlation coefficient (R) of -0.389 and weighted average of $58,008. Similarly, the statistical analysis conducted on geographies consisting of 80,706,071 people shows a weak negative correlation between the proportion of Cheyenne and median male earnings in the United States with a correlation coefficient (R) of -0.212 and weighted average of $46,062, a difference of 25.9%.
Median Male Earnings Correlation Summary
| Measurement | Immigrants from Northern Africa | Cheyenne |
| Minimum | $12,000 | $20,903 |
| Maximum | $84,392 | $71,550 |
| Range | $72,392 | $50,647 |
| Mean | $52,417 | $41,316 |
| Median | $53,736 | $42,260 |
| Interquartile 25% (IQ1) | $45,608 | $33,100 |
| Interquartile 75% (IQ3) | $59,910 | $46,481 |
| Interquartile Range (IQR) | $14,302 | $13,381 |
| Standard Deviation (Sample) | $13,421 | $10,984 |
| Standard Deviation (Population) | $13,260 | $10,799 |
Similar Demographics by Median Male Earnings
Demographics Similar to Immigrants from Northern Africa by Median Male Earnings
In terms of median male earnings, the demographic groups most similar to Immigrants from Northern Africa are Serbian ($57,975, a difference of 0.060%), Immigrants from Uzbekistan ($57,941, a difference of 0.12%), British ($57,890, a difference of 0.20%), Immigrants from Western Asia ($58,131, a difference of 0.21%), and Armenian ($58,134, a difference of 0.22%).
| Demographics | Rating | Rank | Median Male Earnings |
| Immigrants | Poland | 98.0 /100 | #99 | Exceptional $58,452 |
| Assyrians/Chaldeans/Syriacs | 97.9 /100 | #100 | Exceptional $58,437 |
| Immigrants | Brazil | 97.7 /100 | #101 | Exceptional $58,324 |
| Syrians | 97.4 /100 | #102 | Exceptional $58,187 |
| Poles | 97.3 /100 | #103 | Exceptional $58,139 |
| Armenians | 97.3 /100 | #104 | Exceptional $58,134 |
| Immigrants | Western Asia | 97.3 /100 | #105 | Exceptional $58,131 |
| Immigrants | Northern Africa | 96.9 /100 | #106 | Exceptional $58,008 |
| Serbians | 96.8 /100 | #107 | Exceptional $57,975 |
| Immigrants | Uzbekistan | 96.7 /100 | #108 | Exceptional $57,941 |
| British | 96.5 /100 | #109 | Exceptional $57,890 |
| Palestinians | 96.2 /100 | #110 | Exceptional $57,778 |
| Europeans | 95.6 /100 | #111 | Exceptional $57,637 |
| Immigrants | Afghanistan | 95.4 /100 | #112 | Exceptional $57,582 |
| Carpatho Rusyns | 95.3 /100 | #113 | Exceptional $57,572 |
Demographics Similar to Cheyenne by Median Male Earnings
In terms of median male earnings, the demographic groups most similar to Cheyenne are Mexican ($46,147, a difference of 0.18%), Immigrants from Caribbean ($46,193, a difference of 0.28%), Haitian ($45,903, a difference of 0.35%), Immigrants from Guatemala ($46,244, a difference of 0.39%), and Immigrants from Honduras ($45,787, a difference of 0.60%).
| Demographics | Rating | Rank | Median Male Earnings |
| Apache | 0.0 /100 | #311 | Tragic $46,429 |
| Hispanics or Latinos | 0.0 /100 | #312 | Tragic $46,419 |
| Hondurans | 0.0 /100 | #313 | Tragic $46,374 |
| Chippewa | 0.0 /100 | #314 | Tragic $46,368 |
| Immigrants | Guatemala | 0.0 /100 | #315 | Tragic $46,244 |
| Immigrants | Caribbean | 0.0 /100 | #316 | Tragic $46,193 |
| Mexicans | 0.0 /100 | #317 | Tragic $46,147 |
| Cheyenne | 0.0 /100 | #318 | Tragic $46,062 |
| Haitians | 0.0 /100 | #319 | Tragic $45,903 |
| Immigrants | Honduras | 0.0 /100 | #320 | Tragic $45,787 |
| Fijians | 0.0 /100 | #321 | Tragic $45,607 |
| Sioux | 0.0 /100 | #322 | Tragic $45,566 |
| Immigrants | Central America | 0.0 /100 | #323 | Tragic $45,538 |
| Blacks/African Americans | 0.0 /100 | #324 | Tragic $45,523 |
| Yuman | 0.0 /100 | #325 | Tragic $45,446 |