Immigrants from Northern Africa vs Navajo Cognitive Disability
COMPARE
Immigrants from Northern Africa
Navajo
Cognitive Disability
Cognitive Disability Comparison
Immigrants from Northern Africa
Navajo
17.3%
COGNITIVE DISABILITY
50.2/ 100
METRIC RATING
173rd/ 347
METRIC RANK
18.8%
COGNITIVE DISABILITY
0.0/ 100
METRIC RATING
329th/ 347
METRIC RANK
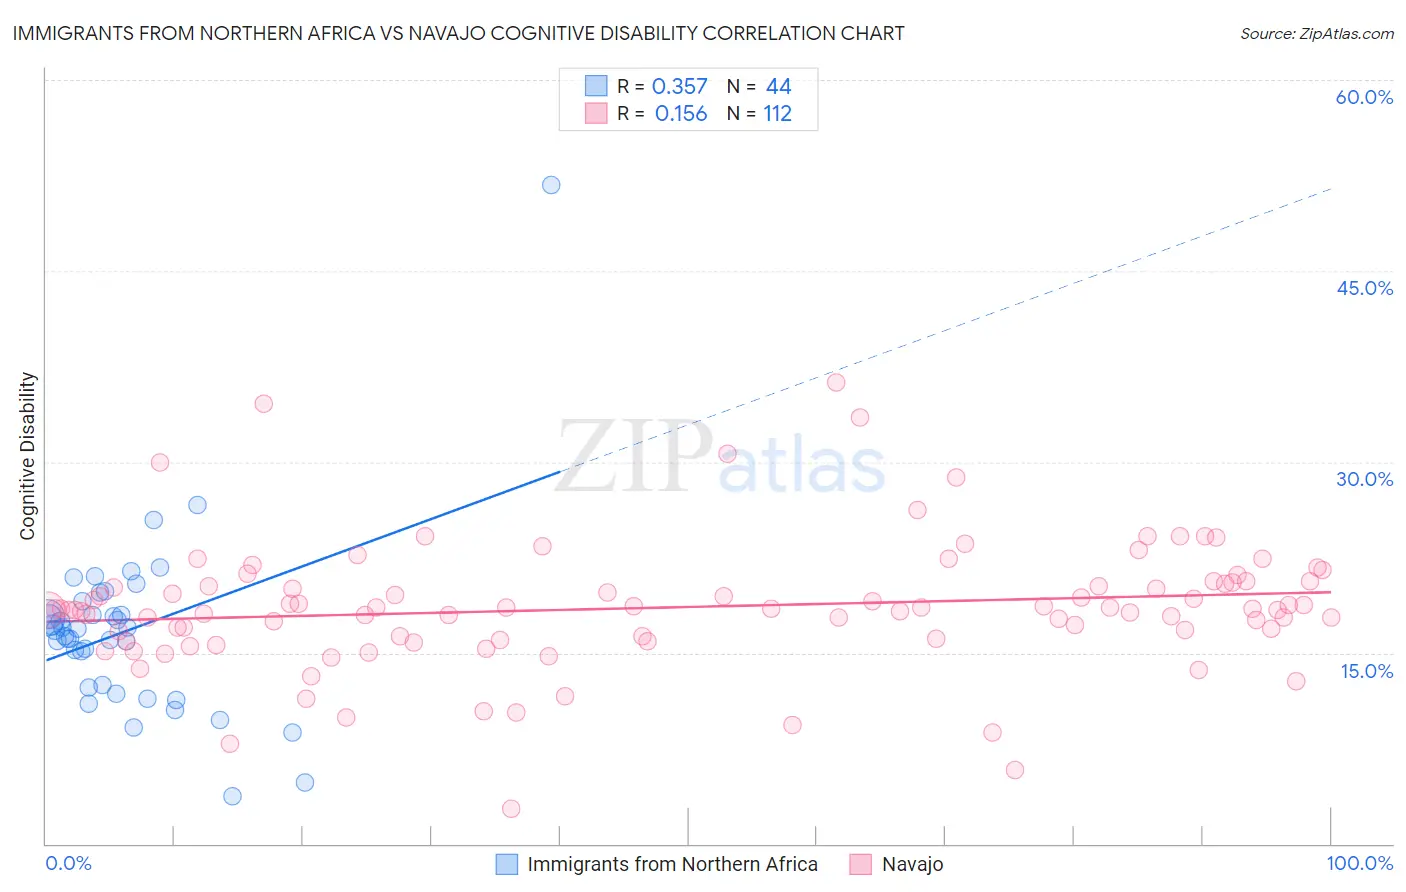
Immigrants from Northern Africa vs Navajo Cognitive Disability Correlation Chart
The statistical analysis conducted on geographies consisting of 321,181,244 people shows a mild positive correlation between the proportion of Immigrants from Northern Africa and percentage of population with cognitive disability in the United States with a correlation coefficient (R) of 0.357 and weighted average of 17.3%. Similarly, the statistical analysis conducted on geographies consisting of 224,779,988 people shows a poor positive correlation between the proportion of Navajo and percentage of population with cognitive disability in the United States with a correlation coefficient (R) of 0.156 and weighted average of 18.8%, a difference of 8.6%.
Cognitive Disability Correlation Summary
| Measurement | Immigrants from Northern Africa | Navajo |
| Minimum | 3.7% | 2.7% |
| Maximum | 51.8% | 36.3% |
| Range | 48.1% | 33.6% |
| Mean | 16.7% | 18.6% |
| Median | 16.8% | 18.4% |
| Interquartile 25% (IQ1) | 12.4% | 16.2% |
| Interquartile 75% (IQ3) | 18.5% | 20.5% |
| Interquartile Range (IQR) | 6.2% | 4.3% |
| Standard Deviation (Sample) | 7.2% | 5.1% |
| Standard Deviation (Population) | 7.1% | 5.1% |
Similar Demographics by Cognitive Disability
Demographics Similar to Immigrants from Northern Africa by Cognitive Disability
In terms of cognitive disability, the demographic groups most similar to Immigrants from Northern Africa are Laotian (17.3%, a difference of 0.010%), Tsimshian (17.3%, a difference of 0.010%), Shoshone (17.3%, a difference of 0.030%), Ute (17.3%, a difference of 0.030%), and Spanish (17.3%, a difference of 0.040%).
| Demographics | Rating | Rank | Cognitive Disability |
| Immigrants | Ecuador | 64.4 /100 | #166 | Good 17.2% |
| Immigrants | Syria | 63.5 /100 | #167 | Good 17.2% |
| Immigrants | Immigrants | 62.5 /100 | #168 | Good 17.2% |
| Immigrants | Portugal | 61.8 /100 | #169 | Good 17.2% |
| Ecuadorians | 59.6 /100 | #170 | Average 17.2% |
| Tlingit-Haida | 59.4 /100 | #171 | Average 17.2% |
| Immigrants | Turkey | 56.7 /100 | #172 | Average 17.2% |
| Immigrants | Northern Africa | 50.2 /100 | #173 | Average 17.3% |
| Laotians | 50.0 /100 | #174 | Average 17.3% |
| Tsimshian | 49.8 /100 | #175 | Average 17.3% |
| Shoshone | 49.2 /100 | #176 | Average 17.3% |
| Ute | 49.1 /100 | #177 | Average 17.3% |
| Spanish | 48.9 /100 | #178 | Average 17.3% |
| Sioux | 48.6 /100 | #179 | Average 17.3% |
| Pakistanis | 43.9 /100 | #180 | Average 17.3% |
Demographics Similar to Navajo by Cognitive Disability
In terms of cognitive disability, the demographic groups most similar to Navajo are Immigrants from Dominican Republic (18.8%, a difference of 0.10%), Pima (18.8%, a difference of 0.16%), Immigrants from Sudan (18.8%, a difference of 0.18%), Kiowa (18.7%, a difference of 0.22%), and Immigrants from Yemen (18.8%, a difference of 0.24%).
| Demographics | Rating | Rank | Cognitive Disability |
| Immigrants | Liberia | 0.0 /100 | #322 | Tragic 18.7% |
| Pueblo | 0.0 /100 | #323 | Tragic 18.7% |
| Dominicans | 0.0 /100 | #324 | Tragic 18.7% |
| Indonesians | 0.0 /100 | #325 | Tragic 18.7% |
| Immigrants | Senegal | 0.0 /100 | #326 | Tragic 18.7% |
| U.S. Virgin Islanders | 0.0 /100 | #327 | Tragic 18.7% |
| Kiowa | 0.0 /100 | #328 | Tragic 18.7% |
| Navajo | 0.0 /100 | #329 | Tragic 18.8% |
| Immigrants | Dominican Republic | 0.0 /100 | #330 | Tragic 18.8% |
| Pima | 0.0 /100 | #331 | Tragic 18.8% |
| Immigrants | Sudan | 0.0 /100 | #332 | Tragic 18.8% |
| Immigrants | Yemen | 0.0 /100 | #333 | Tragic 18.8% |
| Sudanese | 0.0 /100 | #334 | Tragic 18.9% |
| Senegalese | 0.0 /100 | #335 | Tragic 19.0% |
| Blacks/African Americans | 0.0 /100 | #336 | Tragic 19.0% |