Immigrants from Somalia vs Navajo Median Male Earnings
COMPARE
Immigrants from Somalia
Navajo
Median Male Earnings
Median Male Earnings Comparison
Immigrants from Somalia
Navajo
$48,439
MEDIAN MALE EARNINGS
0.3/ 100
METRIC RATING
275th/ 347
METRIC RANK
$42,098
MEDIAN MALE EARNINGS
0.0/ 100
METRIC RATING
340th/ 347
METRIC RANK
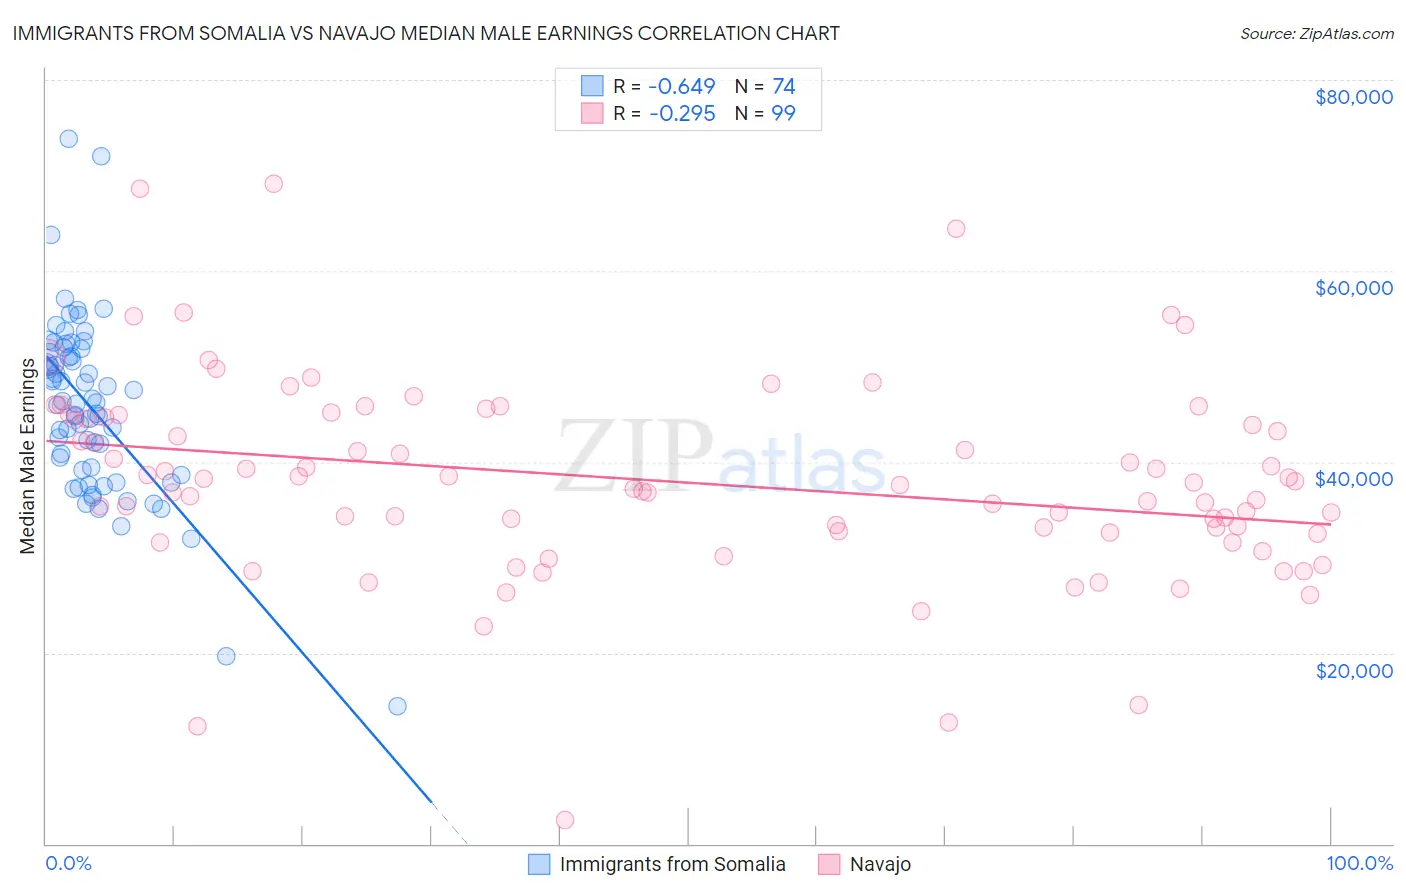
Immigrants from Somalia vs Navajo Median Male Earnings Correlation Chart
The statistical analysis conducted on geographies consisting of 92,109,982 people shows a significant negative correlation between the proportion of Immigrants from Somalia and median male earnings in the United States with a correlation coefficient (R) of -0.649 and weighted average of $48,439. Similarly, the statistical analysis conducted on geographies consisting of 224,788,234 people shows a weak negative correlation between the proportion of Navajo and median male earnings in the United States with a correlation coefficient (R) of -0.295 and weighted average of $42,098, a difference of 15.1%.
Median Male Earnings Correlation Summary
| Measurement | Immigrants from Somalia | Navajo |
| Minimum | $14,382 | $2,499 |
| Maximum | $73,796 | $69,181 |
| Range | $59,414 | $66,682 |
| Mean | $45,683 | $37,941 |
| Median | $46,151 | $37,586 |
| Interquartile 25% (IQ1) | $39,154 | $32,558 |
| Interquartile 75% (IQ3) | $51,463 | $44,589 |
| Interquartile Range (IQR) | $12,309 | $12,031 |
| Standard Deviation (Sample) | $9,409 | $10,577 |
| Standard Deviation (Population) | $9,346 | $10,524 |
Similar Demographics by Median Male Earnings
Demographics Similar to Immigrants from Somalia by Median Male Earnings
In terms of median male earnings, the demographic groups most similar to Immigrants from Somalia are Blackfeet ($48,402, a difference of 0.080%), Colville ($48,516, a difference of 0.16%), Belizean ($48,358, a difference of 0.17%), Immigrants from Liberia ($48,317, a difference of 0.25%), and Hmong ($48,254, a difference of 0.38%).
| Demographics | Rating | Rank | Median Male Earnings |
| Ute | 0.4 /100 | #268 | Tragic $48,899 |
| Tsimshian | 0.4 /100 | #269 | Tragic $48,836 |
| Potawatomi | 0.4 /100 | #270 | Tragic $48,768 |
| Cherokee | 0.3 /100 | #271 | Tragic $48,669 |
| Salvadorans | 0.3 /100 | #272 | Tragic $48,646 |
| Jamaicans | 0.3 /100 | #273 | Tragic $48,632 |
| Colville | 0.3 /100 | #274 | Tragic $48,516 |
| Immigrants | Somalia | 0.3 /100 | #275 | Tragic $48,439 |
| Blackfeet | 0.3 /100 | #276 | Tragic $48,402 |
| Belizeans | 0.2 /100 | #277 | Tragic $48,358 |
| Immigrants | Liberia | 0.2 /100 | #278 | Tragic $48,317 |
| Hmong | 0.2 /100 | #279 | Tragic $48,254 |
| Comanche | 0.2 /100 | #280 | Tragic $48,202 |
| Marshallese | 0.2 /100 | #281 | Tragic $48,137 |
| Central Americans | 0.2 /100 | #282 | Tragic $48,093 |
Demographics Similar to Navajo by Median Male Earnings
In terms of median male earnings, the demographic groups most similar to Navajo are Hopi ($42,060, a difference of 0.090%), Pima ($42,357, a difference of 0.62%), Crow ($42,434, a difference of 0.80%), Arapaho ($41,758, a difference of 0.81%), and Lumbee ($41,715, a difference of 0.92%).
| Demographics | Rating | Rank | Median Male Earnings |
| Immigrants | Congo | 0.0 /100 | #333 | Tragic $44,204 |
| Immigrants | Yemen | 0.0 /100 | #334 | Tragic $44,083 |
| Spanish American Indians | 0.0 /100 | #335 | Tragic $44,010 |
| Immigrants | Cuba | 0.0 /100 | #336 | Tragic $43,461 |
| Menominee | 0.0 /100 | #337 | Tragic $42,581 |
| Crow | 0.0 /100 | #338 | Tragic $42,434 |
| Pima | 0.0 /100 | #339 | Tragic $42,357 |
| Navajo | 0.0 /100 | #340 | Tragic $42,098 |
| Hopi | 0.0 /100 | #341 | Tragic $42,060 |
| Arapaho | 0.0 /100 | #342 | Tragic $41,758 |
| Lumbee | 0.0 /100 | #343 | Tragic $41,715 |
| Pueblo | 0.0 /100 | #344 | Tragic $41,314 |
| Puerto Ricans | 0.0 /100 | #345 | Tragic $40,071 |
| Tohono O'odham | 0.0 /100 | #346 | Tragic $39,543 |
| Yup'ik | 0.0 /100 | #347 | Tragic $39,504 |