Immigrants from Peru vs Cheyenne Median Male Earnings
COMPARE
Immigrants from Peru
Cheyenne
Median Male Earnings
Median Male Earnings Comparison
Immigrants from Peru
Cheyenne
$54,695
MEDIAN MALE EARNINGS
54.9/ 100
METRIC RATING
171st/ 347
METRIC RANK
$46,062
MEDIAN MALE EARNINGS
0.0/ 100
METRIC RATING
318th/ 347
METRIC RANK
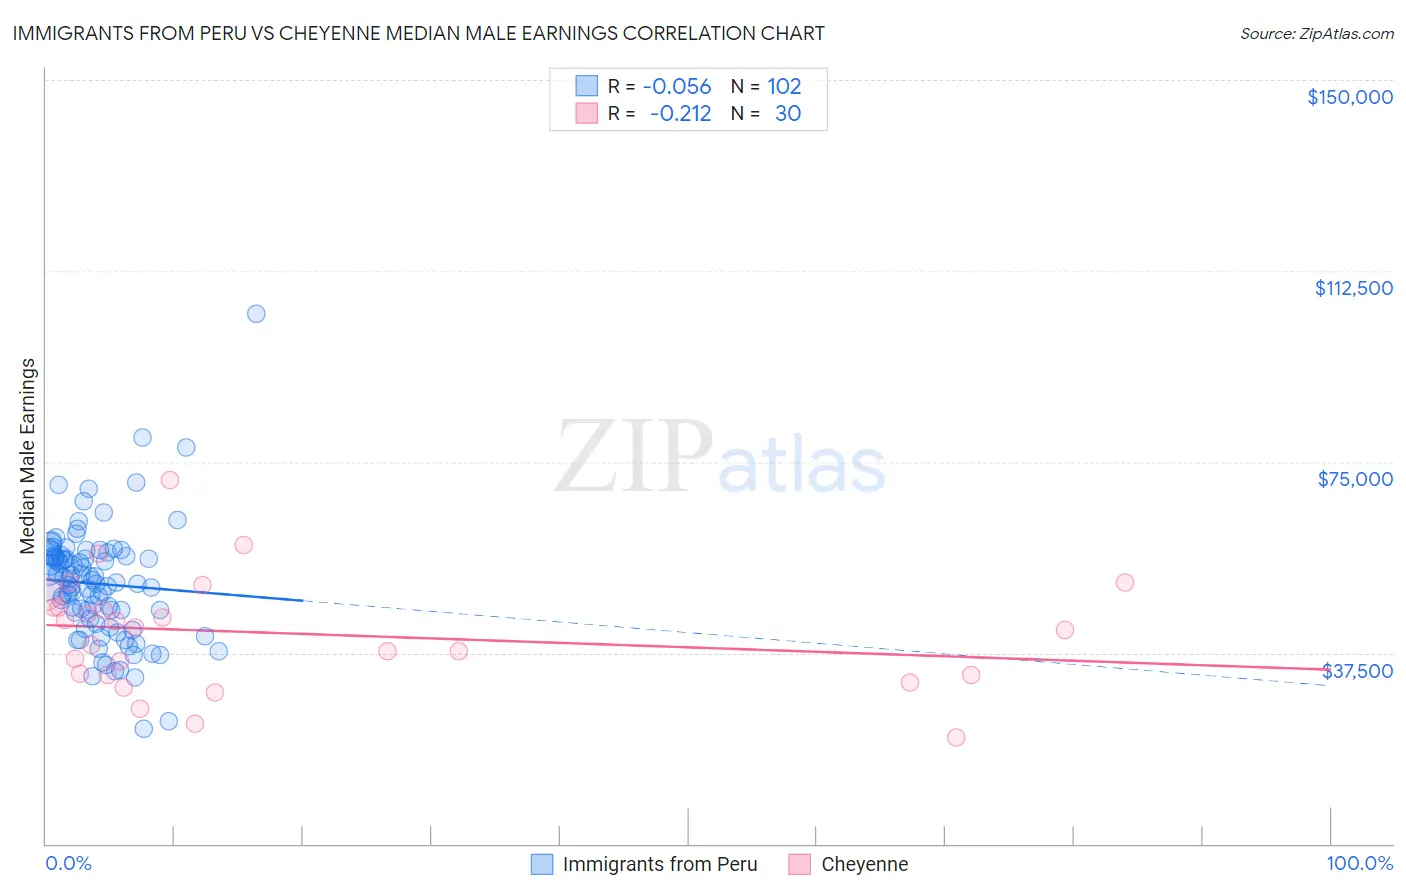
Immigrants from Peru vs Cheyenne Median Male Earnings Correlation Chart
The statistical analysis conducted on geographies consisting of 328,805,303 people shows a slight negative correlation between the proportion of Immigrants from Peru and median male earnings in the United States with a correlation coefficient (R) of -0.056 and weighted average of $54,695. Similarly, the statistical analysis conducted on geographies consisting of 80,706,071 people shows a weak negative correlation between the proportion of Cheyenne and median male earnings in the United States with a correlation coefficient (R) of -0.212 and weighted average of $46,062, a difference of 18.7%.
Median Male Earnings Correlation Summary
| Measurement | Immigrants from Peru | Cheyenne |
| Minimum | $22,560 | $20,903 |
| Maximum | $104,038 | $71,550 |
| Range | $81,478 | $50,647 |
| Mean | $51,057 | $41,316 |
| Median | $51,289 | $42,260 |
| Interquartile 25% (IQ1) | $44,299 | $33,100 |
| Interquartile 75% (IQ3) | $56,461 | $46,481 |
| Interquartile Range (IQR) | $12,162 | $13,381 |
| Standard Deviation (Sample) | $11,444 | $10,984 |
| Standard Deviation (Population) | $11,388 | $10,799 |
Similar Demographics by Median Male Earnings
Demographics Similar to Immigrants from Peru by Median Male Earnings
In terms of median male earnings, the demographic groups most similar to Immigrants from Peru are French Canadian ($54,722, a difference of 0.050%), Finnish ($54,721, a difference of 0.050%), Welsh ($54,647, a difference of 0.090%), South American Indian ($54,508, a difference of 0.34%), and South American ($54,492, a difference of 0.37%).
| Demographics | Rating | Rank | Median Male Earnings |
| Immigrants | South Eastern Asia | 67.6 /100 | #164 | Good $55,241 |
| Immigrants | Portugal | 66.3 /100 | #165 | Good $55,182 |
| Germans | 61.6 /100 | #166 | Good $54,974 |
| Immigrants | Fiji | 61.2 /100 | #167 | Good $54,958 |
| Immigrants | Vietnam | 60.2 /100 | #168 | Good $54,913 |
| French Canadians | 55.6 /100 | #169 | Average $54,722 |
| Finns | 55.6 /100 | #170 | Average $54,721 |
| Immigrants | Peru | 54.9 /100 | #171 | Average $54,695 |
| Welsh | 53.8 /100 | #172 | Average $54,647 |
| South American Indians | 50.4 /100 | #173 | Average $54,508 |
| South Americans | 50.0 /100 | #174 | Average $54,492 |
| Dutch | 48.0 /100 | #175 | Average $54,410 |
| Spaniards | 47.8 /100 | #176 | Average $54,401 |
| Costa Ricans | 44.8 /100 | #177 | Average $54,279 |
| Sierra Leoneans | 44.8 /100 | #178 | Average $54,279 |
Demographics Similar to Cheyenne by Median Male Earnings
In terms of median male earnings, the demographic groups most similar to Cheyenne are Mexican ($46,147, a difference of 0.18%), Immigrants from Caribbean ($46,193, a difference of 0.28%), Haitian ($45,903, a difference of 0.35%), Immigrants from Guatemala ($46,244, a difference of 0.39%), and Immigrants from Honduras ($45,787, a difference of 0.60%).
| Demographics | Rating | Rank | Median Male Earnings |
| Apache | 0.0 /100 | #311 | Tragic $46,429 |
| Hispanics or Latinos | 0.0 /100 | #312 | Tragic $46,419 |
| Hondurans | 0.0 /100 | #313 | Tragic $46,374 |
| Chippewa | 0.0 /100 | #314 | Tragic $46,368 |
| Immigrants | Guatemala | 0.0 /100 | #315 | Tragic $46,244 |
| Immigrants | Caribbean | 0.0 /100 | #316 | Tragic $46,193 |
| Mexicans | 0.0 /100 | #317 | Tragic $46,147 |
| Cheyenne | 0.0 /100 | #318 | Tragic $46,062 |
| Haitians | 0.0 /100 | #319 | Tragic $45,903 |
| Immigrants | Honduras | 0.0 /100 | #320 | Tragic $45,787 |
| Fijians | 0.0 /100 | #321 | Tragic $45,607 |
| Sioux | 0.0 /100 | #322 | Tragic $45,566 |
| Immigrants | Central America | 0.0 /100 | #323 | Tragic $45,538 |
| Blacks/African Americans | 0.0 /100 | #324 | Tragic $45,523 |
| Yuman | 0.0 /100 | #325 | Tragic $45,446 |