Iroquois vs Polish Householder Income Ages 45 - 64 years
COMPARE
Iroquois
Polish
Householder Income Ages 45 - 64 years
Householder Income Ages 45 - 64 years Comparison
Iroquois
Poles
$87,255
HOUSEHOLDER INCOME AGES 45 - 64 YEARS
0.1/ 100
METRIC RATING
274th/ 347
METRIC RANK
$105,952
HOUSEHOLDER INCOME AGES 45 - 64 YEARS
94.4/ 100
METRIC RATING
121st/ 347
METRIC RANK
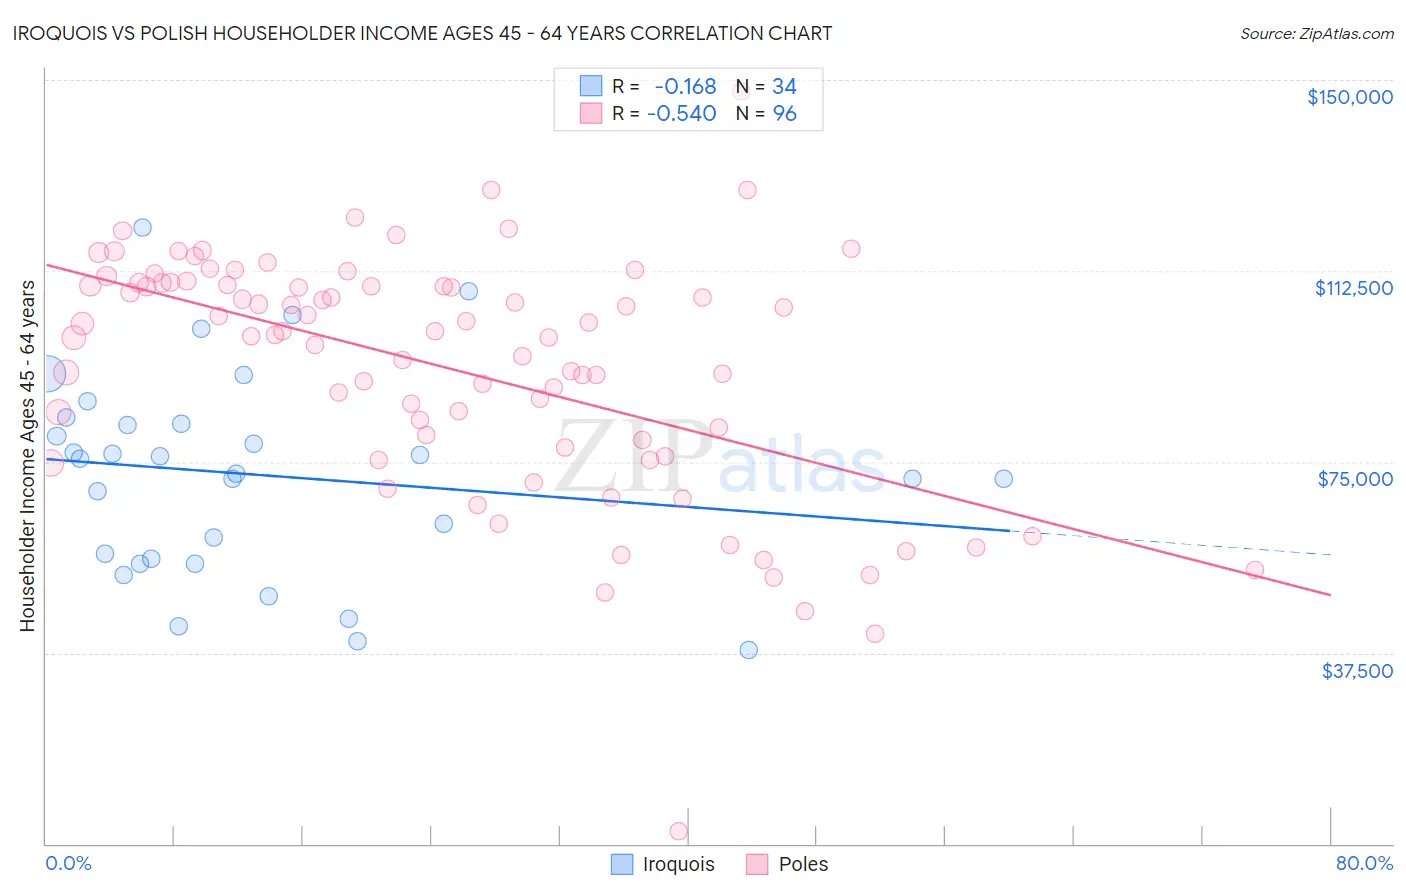
Iroquois vs Polish Householder Income Ages 45 - 64 years Correlation Chart
The statistical analysis conducted on geographies consisting of 207,070,070 people shows a poor negative correlation between the proportion of Iroquois and household income with householder between the ages 45 and 64 in the United States with a correlation coefficient (R) of -0.168 and weighted average of $87,255. Similarly, the statistical analysis conducted on geographies consisting of 557,394,661 people shows a substantial negative correlation between the proportion of Poles and household income with householder between the ages 45 and 64 in the United States with a correlation coefficient (R) of -0.540 and weighted average of $105,952, a difference of 21.4%.
Householder Income Ages 45 - 64 years Correlation Summary
| Measurement | Iroquois | Polish |
| Minimum | $38,056 | $2,499 |
| Maximum | $121,151 | $147,814 |
| Range | $83,095 | $145,315 |
| Mean | $72,442 | $93,436 |
| Median | $74,085 | $100,304 |
| Interquartile 25% (IQ1) | $55,882 | $78,490 |
| Interquartile 75% (IQ3) | $82,434 | $109,945 |
| Interquartile Range (IQR) | $26,552 | $31,456 |
| Standard Deviation (Sample) | $20,014 | $23,791 |
| Standard Deviation (Population) | $19,717 | $23,667 |
Similar Demographics by Householder Income Ages 45 - 64 years
Demographics Similar to Iroquois by Householder Income Ages 45 - 64 years
In terms of householder income ages 45 - 64 years, the demographic groups most similar to Iroquois are Immigrants from Belize ($87,229, a difference of 0.030%), Immigrants from Latin America ($87,219, a difference of 0.040%), Cree ($87,185, a difference of 0.080%), Immigrants from Jamaica ($87,035, a difference of 0.25%), and Yakama ($86,992, a difference of 0.30%).
| Demographics | Rating | Rank | Householder Income Ages 45 - 64 years |
| Hmong | 0.2 /100 | #267 | Tragic $88,115 |
| Immigrants | Micronesia | 0.2 /100 | #268 | Tragic $87,864 |
| Spanish Americans | 0.2 /100 | #269 | Tragic $87,836 |
| Immigrants | Liberia | 0.2 /100 | #270 | Tragic $87,739 |
| Guatemalans | 0.2 /100 | #271 | Tragic $87,705 |
| Cape Verdeans | 0.2 /100 | #272 | Tragic $87,580 |
| Spanish American Indians | 0.2 /100 | #273 | Tragic $87,561 |
| Iroquois | 0.1 /100 | #274 | Tragic $87,255 |
| Immigrants | Belize | 0.1 /100 | #275 | Tragic $87,229 |
| Immigrants | Latin America | 0.1 /100 | #276 | Tragic $87,219 |
| Cree | 0.1 /100 | #277 | Tragic $87,185 |
| Immigrants | Jamaica | 0.1 /100 | #278 | Tragic $87,035 |
| Yakama | 0.1 /100 | #279 | Tragic $86,992 |
| Immigrants | Somalia | 0.1 /100 | #280 | Tragic $86,987 |
| Yaqui | 0.1 /100 | #281 | Tragic $86,914 |
Demographics Similar to Poles by Householder Income Ages 45 - 64 years
In terms of householder income ages 45 - 64 years, the demographic groups most similar to Poles are Immigrants from North Macedonia ($105,892, a difference of 0.060%), Immigrants from South Eastern Asia ($106,109, a difference of 0.15%), Immigrants from Jordan ($106,164, a difference of 0.20%), Immigrants from Western Asia ($106,217, a difference of 0.25%), and Albanian ($106,243, a difference of 0.27%).
| Demographics | Rating | Rank | Householder Income Ages 45 - 64 years |
| Immigrants | Poland | 95.3 /100 | #114 | Exceptional $106,319 |
| Immigrants | Kuwait | 95.2 /100 | #115 | Exceptional $106,285 |
| British | 95.2 /100 | #116 | Exceptional $106,264 |
| Albanians | 95.1 /100 | #117 | Exceptional $106,243 |
| Immigrants | Western Asia | 95.0 /100 | #118 | Exceptional $106,217 |
| Immigrants | Jordan | 94.9 /100 | #119 | Exceptional $106,164 |
| Immigrants | South Eastern Asia | 94.8 /100 | #120 | Exceptional $106,109 |
| Poles | 94.4 /100 | #121 | Exceptional $105,952 |
| Immigrants | North Macedonia | 94.2 /100 | #122 | Exceptional $105,892 |
| Danes | 93.4 /100 | #123 | Exceptional $105,619 |
| Immigrants | Northern Africa | 92.8 /100 | #124 | Exceptional $105,430 |
| Pakistanis | 92.4 /100 | #125 | Exceptional $105,317 |
| Portuguese | 92.4 /100 | #126 | Exceptional $105,309 |
| Immigrants | Saudi Arabia | 92.2 /100 | #127 | Exceptional $105,249 |
| Native Hawaiians | 91.8 /100 | #128 | Exceptional $105,149 |