Immigrants from Dominica vs Danish Householder Income Ages 25 - 44 years
COMPARE
Immigrants from Dominica
Danish
Householder Income Ages 25 - 44 years
Householder Income Ages 25 - 44 years Comparison
Immigrants from Dominica
Danes
$81,351
HOUSEHOLDER INCOME AGES 25 - 44 YEARS
0.1/ 100
METRIC RATING
296th/ 347
METRIC RANK
$97,221
HOUSEHOLDER INCOME AGES 25 - 44 YEARS
81.3/ 100
METRIC RATING
142nd/ 347
METRIC RANK
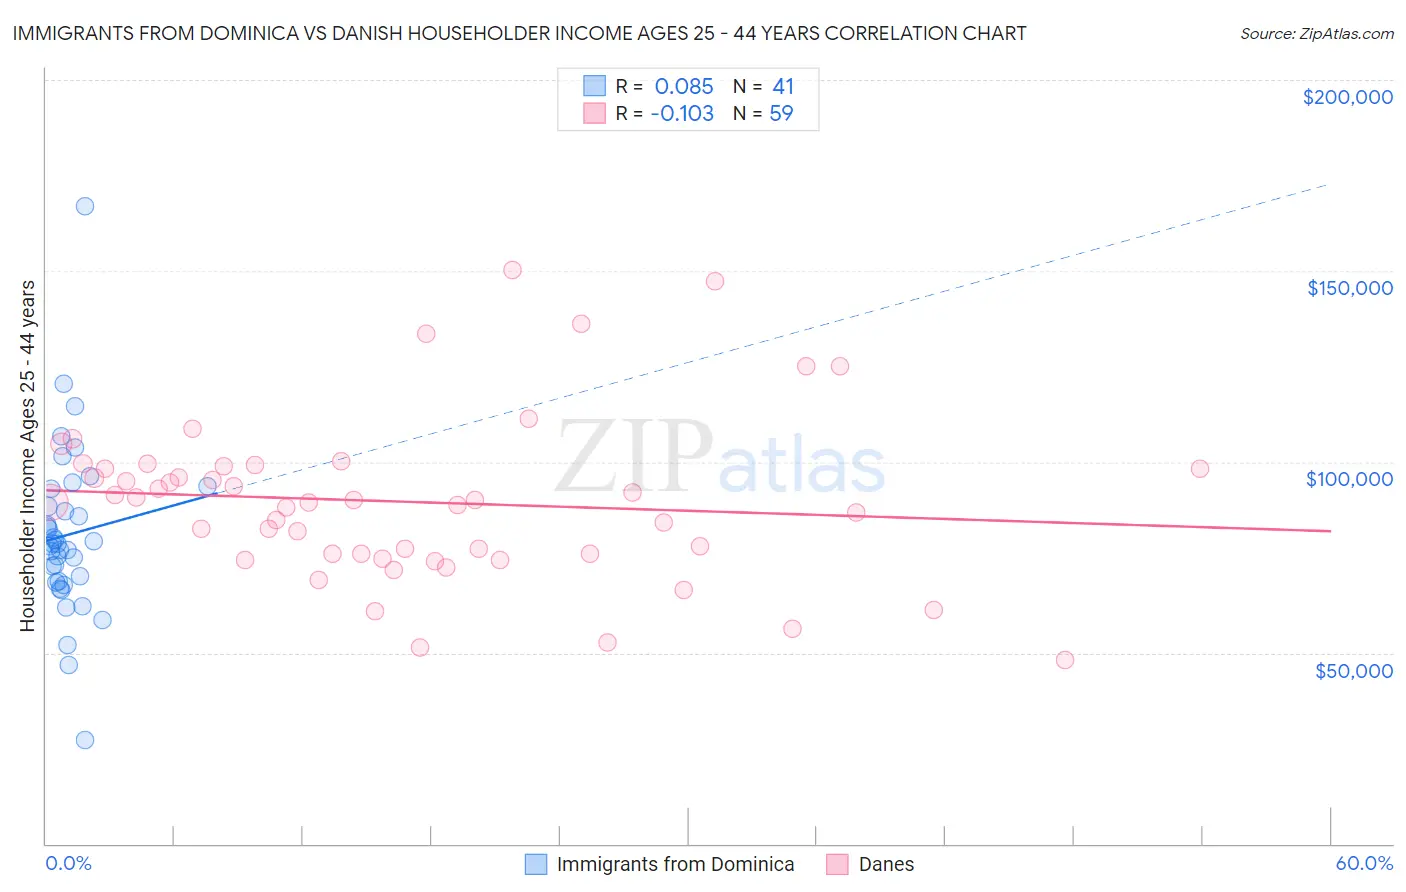
Immigrants from Dominica vs Danish Householder Income Ages 25 - 44 years Correlation Chart
The statistical analysis conducted on geographies consisting of 83,772,470 people shows a slight positive correlation between the proportion of Immigrants from Dominica and household income with householder between the ages 25 and 44 in the United States with a correlation coefficient (R) of 0.085 and weighted average of $81,351. Similarly, the statistical analysis conducted on geographies consisting of 471,956,523 people shows a poor negative correlation between the proportion of Danes and household income with householder between the ages 25 and 44 in the United States with a correlation coefficient (R) of -0.103 and weighted average of $97,221, a difference of 19.5%.
Householder Income Ages 25 - 44 years Correlation Summary
| Measurement | Immigrants from Dominica | Danish |
| Minimum | $27,269 | $48,125 |
| Maximum | $167,054 | $150,222 |
| Range | $139,785 | $102,097 |
| Mean | $80,956 | $89,539 |
| Median | $78,585 | $89,288 |
| Interquartile 25% (IQ1) | $68,699 | $75,783 |
| Interquartile 75% (IQ3) | $90,712 | $98,883 |
| Interquartile Range (IQR) | $22,013 | $23,100 |
| Standard Deviation (Sample) | $22,322 | $21,492 |
| Standard Deviation (Population) | $22,048 | $21,309 |
Similar Demographics by Householder Income Ages 25 - 44 years
Demographics Similar to Immigrants from Dominica by Householder Income Ages 25 - 44 years
In terms of householder income ages 25 - 44 years, the demographic groups most similar to Immigrants from Dominica are Immigrants from Guatemala ($81,341, a difference of 0.010%), Bangladeshi ($81,363, a difference of 0.020%), Dominican ($81,229, a difference of 0.15%), Cuban ($81,483, a difference of 0.16%), and Blackfeet ($81,531, a difference of 0.22%).
| Demographics | Rating | Rank | Householder Income Ages 25 - 44 years |
| Shoshone | 0.1 /100 | #289 | Tragic $82,062 |
| Liberians | 0.1 /100 | #290 | Tragic $82,005 |
| Potawatomi | 0.1 /100 | #291 | Tragic $81,774 |
| Yaqui | 0.1 /100 | #292 | Tragic $81,656 |
| Blackfeet | 0.1 /100 | #293 | Tragic $81,531 |
| Cubans | 0.1 /100 | #294 | Tragic $81,483 |
| Bangladeshis | 0.1 /100 | #295 | Tragic $81,363 |
| Immigrants | Dominica | 0.1 /100 | #296 | Tragic $81,351 |
| Immigrants | Guatemala | 0.1 /100 | #297 | Tragic $81,341 |
| Dominicans | 0.1 /100 | #298 | Tragic $81,229 |
| Immigrants | Liberia | 0.1 /100 | #299 | Tragic $80,863 |
| Cherokee | 0.0 /100 | #300 | Tragic $80,843 |
| Immigrants | Micronesia | 0.0 /100 | #301 | Tragic $80,544 |
| Hispanics or Latinos | 0.0 /100 | #302 | Tragic $80,515 |
| Mexicans | 0.0 /100 | #303 | Tragic $80,427 |
Demographics Similar to Danes by Householder Income Ages 25 - 44 years
In terms of householder income ages 25 - 44 years, the demographic groups most similar to Danes are Luxembourger ($97,237, a difference of 0.020%), Immigrants from Jordan ($97,185, a difference of 0.040%), Immigrants from Chile ($97,159, a difference of 0.060%), Immigrants from Morocco ($97,305, a difference of 0.090%), and Immigrants from Peru ($97,329, a difference of 0.11%).
| Demographics | Rating | Rank | Householder Income Ages 25 - 44 years |
| Immigrants | Oceania | 84.5 /100 | #135 | Excellent $97,623 |
| Hungarians | 83.9 /100 | #136 | Excellent $97,544 |
| Lebanese | 82.3 /100 | #137 | Excellent $97,339 |
| Arabs | 82.3 /100 | #138 | Excellent $97,336 |
| Immigrants | Peru | 82.2 /100 | #139 | Excellent $97,329 |
| Immigrants | Morocco | 82.0 /100 | #140 | Excellent $97,305 |
| Luxembourgers | 81.5 /100 | #141 | Excellent $97,237 |
| Danes | 81.3 /100 | #142 | Excellent $97,221 |
| Immigrants | Jordan | 81.0 /100 | #143 | Excellent $97,185 |
| Immigrants | Chile | 80.8 /100 | #144 | Excellent $97,159 |
| Norwegians | 78.2 /100 | #145 | Good $96,866 |
| Ethiopians | 77.8 /100 | #146 | Good $96,824 |
| Immigrants | Syria | 77.4 /100 | #147 | Good $96,789 |
| Irish | 76.9 /100 | #148 | Good $96,730 |
| Basques | 76.6 /100 | #149 | Good $96,709 |