Immigrants from North Macedonia vs Immigrants from Ethiopia Householder Income Ages 25 - 44 years
COMPARE
Immigrants from North Macedonia
Immigrants from Ethiopia
Householder Income Ages 25 - 44 years
Householder Income Ages 25 - 44 years Comparison
Immigrants from North Macedonia
Immigrants from Ethiopia
$100,101
HOUSEHOLDER INCOME AGES 25 - 44 YEARS
95.6/ 100
METRIC RATING
109th/ 347
METRIC RANK
$95,256
HOUSEHOLDER INCOME AGES 25 - 44 YEARS
59.5/ 100
METRIC RATING
166th/ 347
METRIC RANK
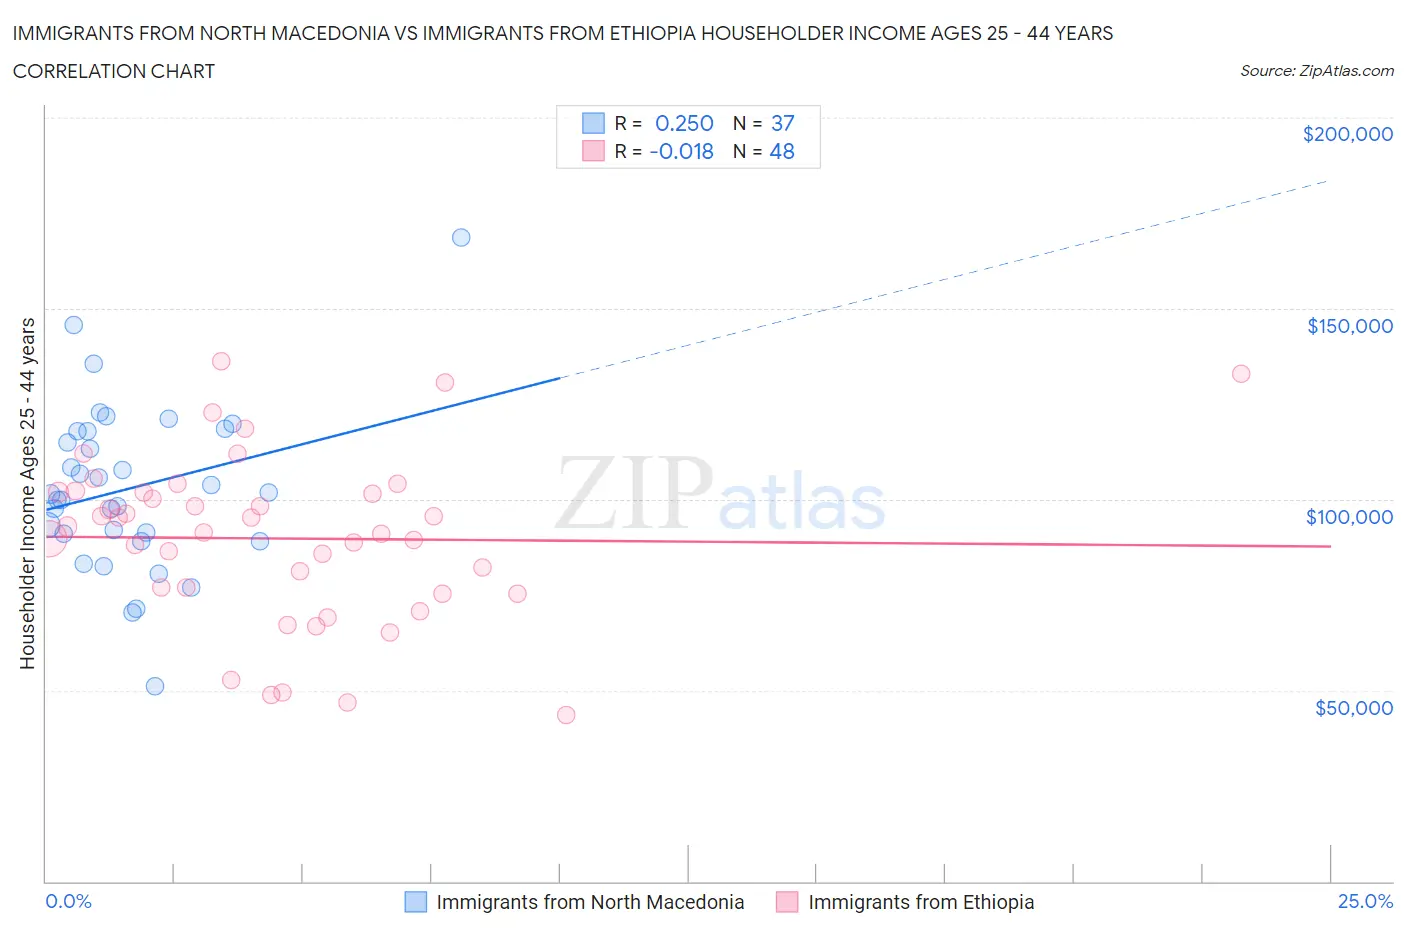
Immigrants from North Macedonia vs Immigrants from Ethiopia Householder Income Ages 25 - 44 years Correlation Chart
The statistical analysis conducted on geographies consisting of 74,266,818 people shows a weak positive correlation between the proportion of Immigrants from North Macedonia and household income with householder between the ages 25 and 44 in the United States with a correlation coefficient (R) of 0.250 and weighted average of $100,101. Similarly, the statistical analysis conducted on geographies consisting of 211,298,235 people shows no correlation between the proportion of Immigrants from Ethiopia and household income with householder between the ages 25 and 44 in the United States with a correlation coefficient (R) of -0.018 and weighted average of $95,256, a difference of 5.1%.
Householder Income Ages 25 - 44 years Correlation Summary
| Measurement | Immigrants from North Macedonia | Immigrants from Ethiopia |
| Minimum | $51,151 | $43,552 |
| Maximum | $168,534 | $136,169 |
| Range | $117,383 | $92,617 |
| Mean | $102,890 | $89,756 |
| Median | $101,325 | $92,049 |
| Interquartile 25% (IQ1) | $89,993 | $76,125 |
| Interquartile 75% (IQ3) | $117,844 | $101,763 |
| Interquartile Range (IQR) | $27,851 | $25,638 |
| Standard Deviation (Sample) | $21,872 | $21,797 |
| Standard Deviation (Population) | $21,575 | $21,568 |
Similar Demographics by Householder Income Ages 25 - 44 years
Demographics Similar to Immigrants from North Macedonia by Householder Income Ages 25 - 44 years
In terms of householder income ages 25 - 44 years, the demographic groups most similar to Immigrants from North Macedonia are Immigrants from Afghanistan ($99,977, a difference of 0.12%), Immigrants from South Eastern Asia ($100,283, a difference of 0.18%), Chilean ($99,900, a difference of 0.20%), Northern European ($100,457, a difference of 0.36%), and Polish ($99,685, a difference of 0.42%).
| Demographics | Rating | Rank | Householder Income Ages 25 - 44 years |
| Immigrants | Lebanon | 97.4 /100 | #102 | Exceptional $101,124 |
| Immigrants | Moldova | 97.4 /100 | #103 | Exceptional $101,091 |
| Immigrants | Poland | 97.4 /100 | #104 | Exceptional $101,065 |
| Immigrants | Vietnam | 96.5 /100 | #105 | Exceptional $100,535 |
| Immigrants | Brazil | 96.5 /100 | #106 | Exceptional $100,534 |
| Northern Europeans | 96.3 /100 | #107 | Exceptional $100,457 |
| Immigrants | South Eastern Asia | 96.0 /100 | #108 | Exceptional $100,283 |
| Immigrants | North Macedonia | 95.6 /100 | #109 | Exceptional $100,101 |
| Immigrants | Afghanistan | 95.3 /100 | #110 | Exceptional $99,977 |
| Chileans | 95.1 /100 | #111 | Exceptional $99,900 |
| Poles | 94.5 /100 | #112 | Exceptional $99,685 |
| Tongans | 94.2 /100 | #113 | Exceptional $99,604 |
| Immigrants | Western Asia | 94.0 /100 | #114 | Exceptional $99,516 |
| Carpatho Rusyns | 93.7 /100 | #115 | Exceptional $99,449 |
| Portuguese | 93.7 /100 | #116 | Exceptional $99,429 |
Demographics Similar to Immigrants from Ethiopia by Householder Income Ages 25 - 44 years
In terms of householder income ages 25 - 44 years, the demographic groups most similar to Immigrants from Ethiopia are Immigrants from Nepal ($95,322, a difference of 0.070%), South American ($95,362, a difference of 0.11%), Immigrants from Saudi Arabia ($95,450, a difference of 0.20%), Czechoslovakian ($95,070, a difference of 0.20%), and Alsatian ($95,059, a difference of 0.21%).
| Demographics | Rating | Rank | Householder Income Ages 25 - 44 years |
| Costa Ricans | 63.5 /100 | #159 | Good $95,565 |
| Icelanders | 63.4 /100 | #160 | Good $95,560 |
| Immigrants | Portugal | 62.8 /100 | #161 | Good $95,512 |
| Swiss | 62.8 /100 | #162 | Good $95,511 |
| Immigrants | Saudi Arabia | 62.0 /100 | #163 | Good $95,450 |
| South Americans | 60.9 /100 | #164 | Good $95,362 |
| Immigrants | Nepal | 60.3 /100 | #165 | Good $95,322 |
| Immigrants | Ethiopia | 59.5 /100 | #166 | Average $95,256 |
| Czechoslovakians | 57.0 /100 | #167 | Average $95,070 |
| Alsatians | 56.8 /100 | #168 | Average $95,059 |
| Native Hawaiians | 56.8 /100 | #169 | Average $95,058 |
| Slovaks | 56.4 /100 | #170 | Average $95,032 |
| Immigrants | Armenia | 54.2 /100 | #171 | Average $94,867 |
| Scottish | 50.8 /100 | #172 | Average $94,622 |
| Finns | 50.6 /100 | #173 | Average $94,610 |