Immigrants from Bulgaria vs Finnish Householder Income Ages 45 - 64 years
COMPARE
Immigrants from Bulgaria
Finnish
Householder Income Ages 45 - 64 years
Householder Income Ages 45 - 64 years Comparison
Immigrants from Bulgaria
Finns
$109,379
HOUSEHOLDER INCOME AGES 45 - 64 YEARS
98.9/ 100
METRIC RATING
79th/ 347
METRIC RANK
$99,904
HOUSEHOLDER INCOME AGES 45 - 64 YEARS
44.8/ 100
METRIC RATING
182nd/ 347
METRIC RANK
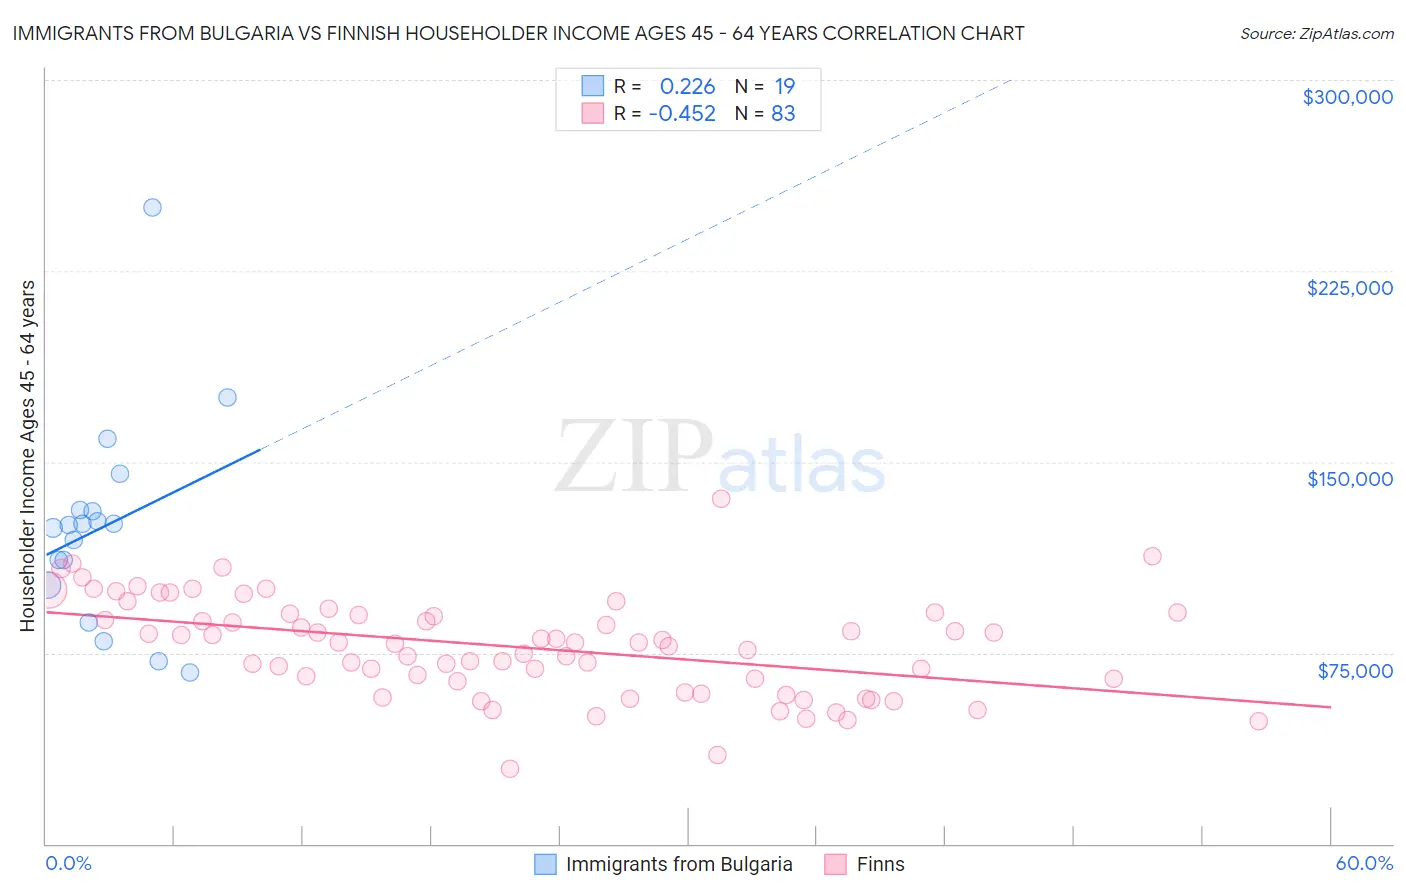
Immigrants from Bulgaria vs Finnish Householder Income Ages 45 - 64 years Correlation Chart
The statistical analysis conducted on geographies consisting of 172,506,403 people shows a weak positive correlation between the proportion of Immigrants from Bulgaria and household income with householder between the ages 45 and 64 in the United States with a correlation coefficient (R) of 0.226 and weighted average of $109,379. Similarly, the statistical analysis conducted on geographies consisting of 404,016,937 people shows a moderate negative correlation between the proportion of Finns and household income with householder between the ages 45 and 64 in the United States with a correlation coefficient (R) of -0.452 and weighted average of $99,904, a difference of 9.5%.
Householder Income Ages 45 - 64 years Correlation Summary
| Measurement | Immigrants from Bulgaria | Finnish |
| Minimum | $67,188 | $29,583 |
| Maximum | $250,001 | $135,625 |
| Range | $182,813 | $106,042 |
| Mean | $124,619 | $77,268 |
| Median | $125,429 | $78,849 |
| Interquartile 25% (IQ1) | $101,725 | $63,712 |
| Interquartile 75% (IQ3) | $131,294 | $90,163 |
| Interquartile Range (IQR) | $29,569 | $26,451 |
| Standard Deviation (Sample) | $41,151 | $19,265 |
| Standard Deviation (Population) | $40,053 | $19,148 |
Similar Demographics by Householder Income Ages 45 - 64 years
Demographics Similar to Immigrants from Bulgaria by Householder Income Ages 45 - 64 years
In terms of householder income ages 45 - 64 years, the demographic groups most similar to Immigrants from Bulgaria are Jordanian ($109,376, a difference of 0.0%), Immigrants from Canada ($109,402, a difference of 0.020%), Immigrants from Eastern Europe ($109,335, a difference of 0.040%), Paraguayan ($109,447, a difference of 0.060%), and Immigrants from England ($109,446, a difference of 0.060%).
| Demographics | Rating | Rank | Householder Income Ages 45 - 64 years |
| Assyrians/Chaldeans/Syriacs | 99.3 /100 | #72 | Exceptional $110,201 |
| Argentineans | 99.3 /100 | #73 | Exceptional $110,103 |
| Immigrants | Egypt | 99.2 /100 | #74 | Exceptional $109,941 |
| South Africans | 99.1 /100 | #75 | Exceptional $109,719 |
| Paraguayans | 99.0 /100 | #76 | Exceptional $109,447 |
| Immigrants | England | 99.0 /100 | #77 | Exceptional $109,446 |
| Immigrants | Canada | 99.0 /100 | #78 | Exceptional $109,402 |
| Immigrants | Bulgaria | 98.9 /100 | #79 | Exceptional $109,379 |
| Jordanians | 98.9 /100 | #80 | Exceptional $109,376 |
| Immigrants | Eastern Europe | 98.9 /100 | #81 | Exceptional $109,335 |
| Immigrants | North America | 98.8 /100 | #82 | Exceptional $109,198 |
| Immigrants | Spain | 98.8 /100 | #83 | Exceptional $109,051 |
| Immigrants | Western Europe | 98.6 /100 | #84 | Exceptional $108,824 |
| Immigrants | Afghanistan | 98.6 /100 | #85 | Exceptional $108,785 |
| Austrians | 98.5 /100 | #86 | Exceptional $108,692 |
Demographics Similar to Finns by Householder Income Ages 45 - 64 years
In terms of householder income ages 45 - 64 years, the demographic groups most similar to Finns are Spaniard ($99,889, a difference of 0.010%), Immigrants ($99,943, a difference of 0.040%), French ($99,824, a difference of 0.080%), Colombian ($99,772, a difference of 0.13%), and Aleut ($100,052, a difference of 0.15%).
| Demographics | Rating | Rank | Householder Income Ages 45 - 64 years |
| Germans | 48.8 /100 | #175 | Average $100,224 |
| Immigrants | Costa Rica | 47.7 /100 | #176 | Average $100,141 |
| Moroccans | 47.7 /100 | #177 | Average $100,138 |
| Immigrants | Cameroon | 47.0 /100 | #178 | Average $100,084 |
| Belgians | 46.7 /100 | #179 | Average $100,060 |
| Aleuts | 46.6 /100 | #180 | Average $100,052 |
| Immigrants | Immigrants | 45.3 /100 | #181 | Average $99,943 |
| Finns | 44.8 /100 | #182 | Average $99,904 |
| Spaniards | 44.6 /100 | #183 | Average $99,889 |
| French | 43.8 /100 | #184 | Average $99,824 |
| Colombians | 43.2 /100 | #185 | Average $99,772 |
| Dutch | 41.7 /100 | #186 | Average $99,650 |
| Iraqis | 38.5 /100 | #187 | Fair $99,387 |
| Immigrants | Portugal | 36.3 /100 | #188 | Fair $99,203 |
| Immigrants | South America | 35.4 /100 | #189 | Fair $99,126 |