Immigrants from Netherlands vs Immigrants from Uzbekistan Median Earnings
COMPARE
Immigrants from Netherlands
Immigrants from Uzbekistan
Median Earnings
Median Earnings Comparison
Immigrants from Netherlands
Immigrants from Uzbekistan
$50,818
MEDIAN EARNINGS
99.8/ 100
METRIC RATING
73rd/ 347
METRIC RANK
$50,151
MEDIAN EARNINGS
99.5/ 100
METRIC RATING
87th/ 347
METRIC RANK
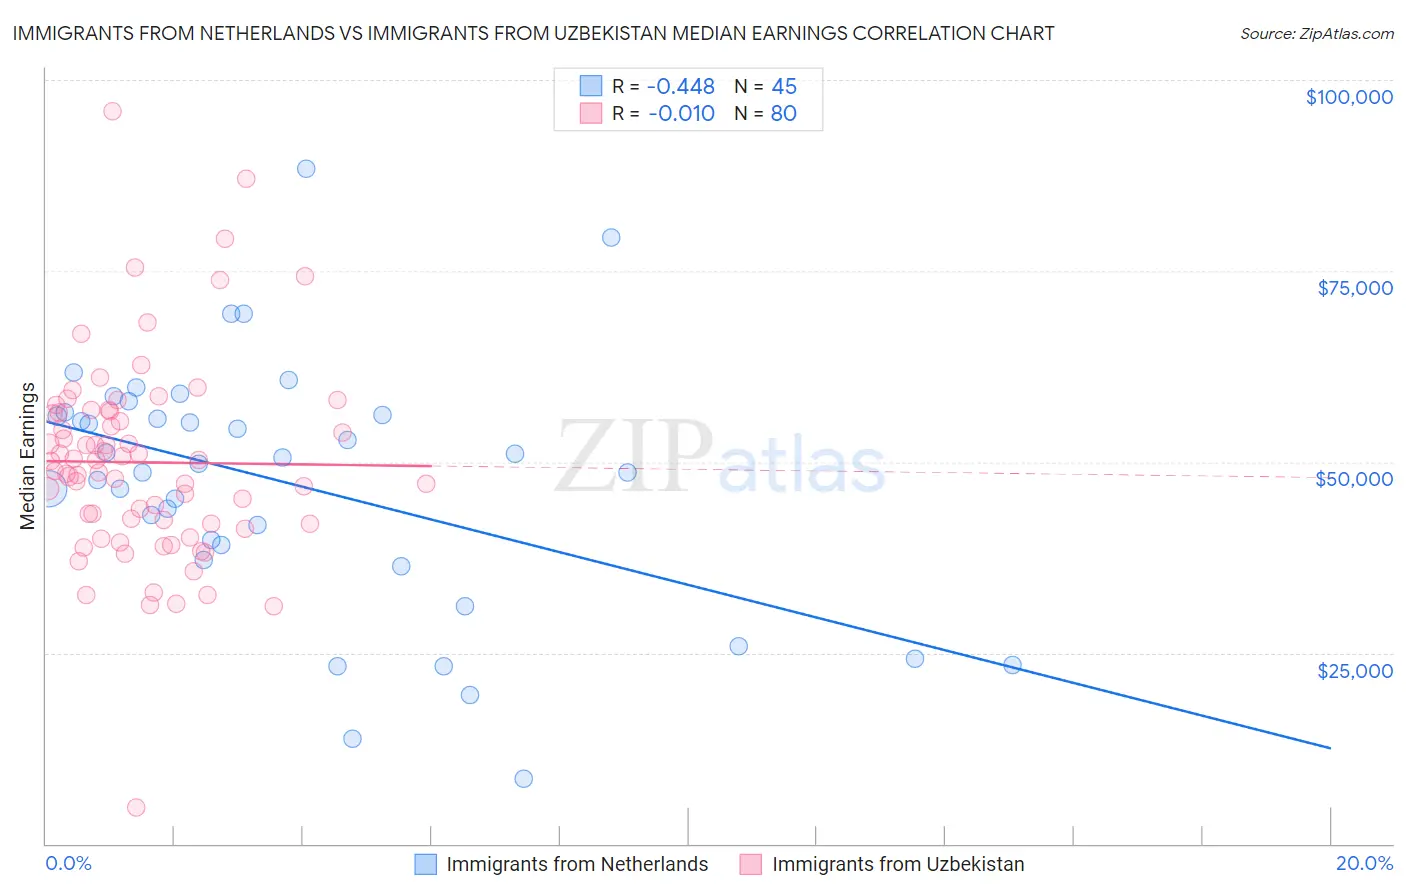
Immigrants from Netherlands vs Immigrants from Uzbekistan Median Earnings Correlation Chart
The statistical analysis conducted on geographies consisting of 237,873,103 people shows a moderate negative correlation between the proportion of Immigrants from Netherlands and median earnings in the United States with a correlation coefficient (R) of -0.448 and weighted average of $50,818. Similarly, the statistical analysis conducted on geographies consisting of 118,764,980 people shows no correlation between the proportion of Immigrants from Uzbekistan and median earnings in the United States with a correlation coefficient (R) of -0.010 and weighted average of $50,151, a difference of 1.3%.
Median Earnings Correlation Summary
| Measurement | Immigrants from Netherlands | Immigrants from Uzbekistan |
| Minimum | $8,447 | $4,716 |
| Maximum | $88,336 | $95,833 |
| Range | $79,889 | $91,117 |
| Mean | $47,130 | $49,941 |
| Median | $49,796 | $49,455 |
| Interquartile 25% (IQ1) | $38,138 | $41,888 |
| Interquartile 75% (IQ3) | $56,269 | $56,559 |
| Interquartile Range (IQR) | $18,130 | $14,671 |
| Standard Deviation (Sample) | $16,545 | $13,280 |
| Standard Deviation (Population) | $16,360 | $13,197 |
Demographics Similar to Immigrants from Netherlands and Immigrants from Uzbekistan by Median Earnings
In terms of median earnings, the demographic groups most similar to Immigrants from Netherlands are South African ($50,752, a difference of 0.13%), Immigrants from Scotland ($50,741, a difference of 0.15%), Immigrants from Egypt ($50,901, a difference of 0.16%), Immigrants from Ukraine ($50,984, a difference of 0.33%), and Lithuanian ($50,991, a difference of 0.34%). Similarly, the demographic groups most similar to Immigrants from Uzbekistan are Albanian ($50,116, a difference of 0.070%), Immigrants from Canada ($50,192, a difference of 0.080%), Immigrants from North America ($50,108, a difference of 0.090%), Immigrants from Hungary ($50,227, a difference of 0.15%), and Immigrants from Kazakhstan ($50,225, a difference of 0.15%).
| Demographics | Rating | Rank | Median Earnings |
| Lithuanians | 99.8 /100 | #70 | Exceptional $50,991 |
| Immigrants | Ukraine | 99.8 /100 | #71 | Exceptional $50,984 |
| Immigrants | Egypt | 99.8 /100 | #72 | Exceptional $50,901 |
| Immigrants | Netherlands | 99.8 /100 | #73 | Exceptional $50,818 |
| South Africans | 99.8 /100 | #74 | Exceptional $50,752 |
| Immigrants | Scotland | 99.8 /100 | #75 | Exceptional $50,741 |
| Immigrants | Italy | 99.7 /100 | #76 | Exceptional $50,581 |
| Immigrants | Western Europe | 99.7 /100 | #77 | Exceptional $50,549 |
| Argentineans | 99.6 /100 | #78 | Exceptional $50,399 |
| Laotians | 99.6 /100 | #79 | Exceptional $50,343 |
| Ukrainians | 99.6 /100 | #80 | Exceptional $50,320 |
| Immigrants | Southern Europe | 99.6 /100 | #81 | Exceptional $50,280 |
| Immigrants | Moldova | 99.5 /100 | #82 | Exceptional $50,274 |
| Romanians | 99.5 /100 | #83 | Exceptional $50,244 |
| Immigrants | Hungary | 99.5 /100 | #84 | Exceptional $50,227 |
| Immigrants | Kazakhstan | 99.5 /100 | #85 | Exceptional $50,225 |
| Immigrants | Canada | 99.5 /100 | #86 | Exceptional $50,192 |
| Immigrants | Uzbekistan | 99.5 /100 | #87 | Exceptional $50,151 |
| Albanians | 99.4 /100 | #88 | Exceptional $50,116 |
| Immigrants | North America | 99.4 /100 | #89 | Exceptional $50,108 |
| Italians | 99.3 /100 | #90 | Exceptional $49,915 |