Immigrants from Netherlands vs Eastern European Currently Married
COMPARE
Immigrants from Netherlands
Eastern European
Currently Married
Currently Married Comparison
Immigrants from Netherlands
Eastern Europeans
48.5%
CURRENTLY MARRIED
98.6/ 100
METRIC RATING
57th/ 347
METRIC RANK
48.9%
CURRENTLY MARRIED
99.5/ 100
METRIC RATING
30th/ 347
METRIC RANK
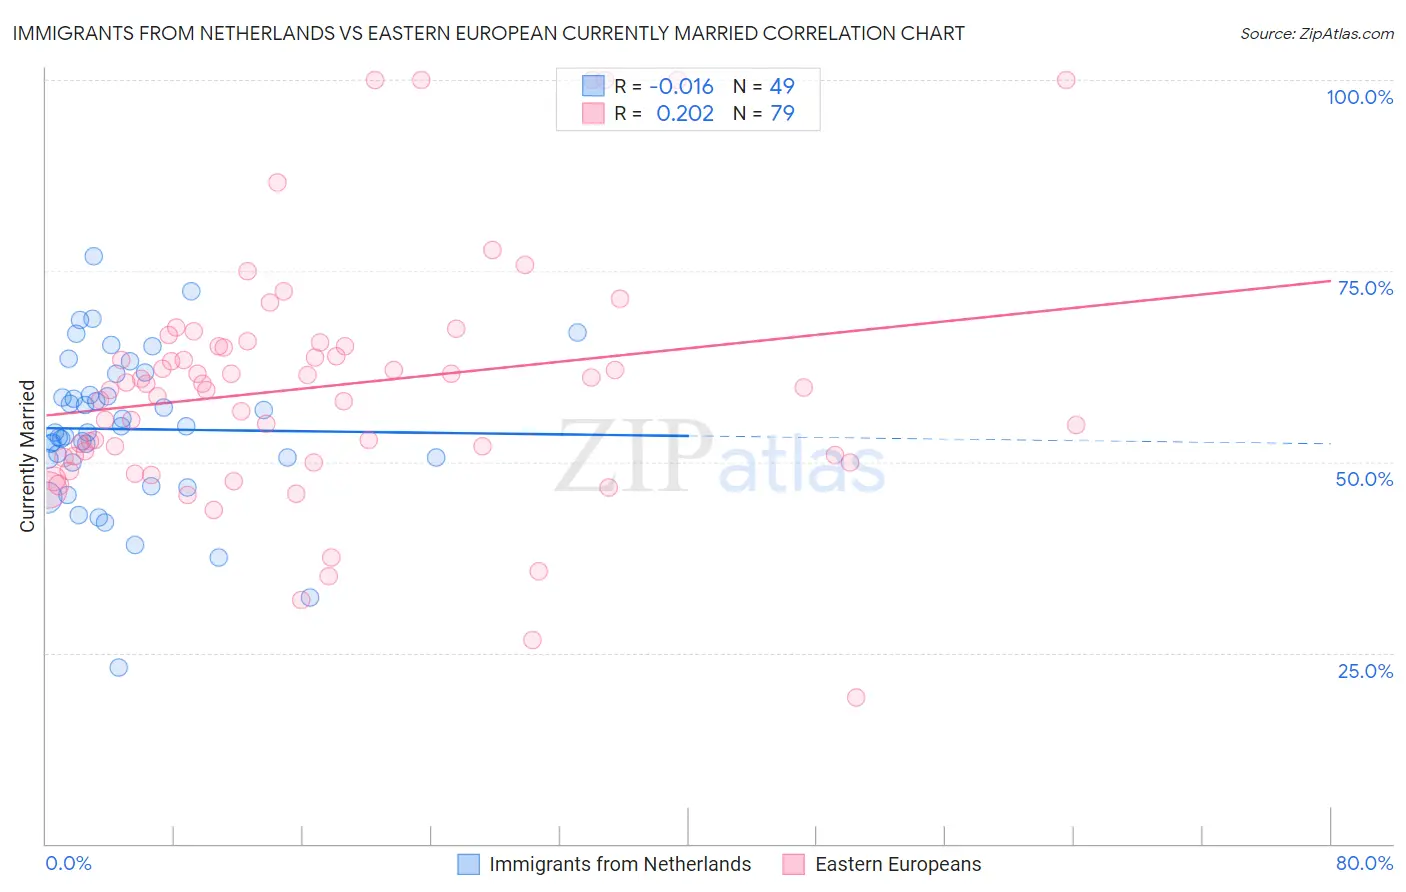
Immigrants from Netherlands vs Eastern European Currently Married Correlation Chart
The statistical analysis conducted on geographies consisting of 237,864,062 people shows no correlation between the proportion of Immigrants from Netherlands and percentage of population currently married in the United States with a correlation coefficient (R) of -0.016 and weighted average of 48.5%. Similarly, the statistical analysis conducted on geographies consisting of 461,211,014 people shows a weak positive correlation between the proportion of Eastern Europeans and percentage of population currently married in the United States with a correlation coefficient (R) of 0.202 and weighted average of 48.9%, a difference of 0.91%.
Currently Married Correlation Summary
| Measurement | Immigrants from Netherlands | Eastern European |
| Minimum | 23.1% | 19.2% |
| Maximum | 76.9% | 100.0% |
| Range | 53.8% | 80.8% |
| Mean | 54.3% | 59.9% |
| Median | 53.9% | 59.8% |
| Interquartile 25% (IQ1) | 50.2% | 50.5% |
| Interquartile 75% (IQ3) | 60.2% | 65.2% |
| Interquartile Range (IQR) | 10.0% | 14.7% |
| Standard Deviation (Sample) | 10.1% | 16.1% |
| Standard Deviation (Population) | 10.0% | 16.0% |
Similar Demographics by Currently Married
Demographics Similar to Immigrants from Netherlands by Currently Married
In terms of currently married, the demographic groups most similar to Immigrants from Netherlands are Immigrants from Moldova (48.5%, a difference of 0.030%), Immigrants from North Macedonia (48.5%, a difference of 0.030%), Latvian (48.5%, a difference of 0.030%), French (48.4%, a difference of 0.040%), and Immigrants from Ireland (48.4%, a difference of 0.070%).
| Demographics | Rating | Rank | Currently Married |
| Iranians | 99.0 /100 | #50 | Exceptional 48.6% |
| Whites/Caucasians | 99.0 /100 | #51 | Exceptional 48.6% |
| Russians | 98.9 /100 | #52 | Exceptional 48.6% |
| Immigrants | Austria | 98.8 /100 | #53 | Exceptional 48.5% |
| Immigrants | Moldova | 98.7 /100 | #54 | Exceptional 48.5% |
| Immigrants | North Macedonia | 98.7 /100 | #55 | Exceptional 48.5% |
| Latvians | 98.7 /100 | #56 | Exceptional 48.5% |
| Immigrants | Netherlands | 98.6 /100 | #57 | Exceptional 48.5% |
| French | 98.6 /100 | #58 | Exceptional 48.4% |
| Immigrants | Ireland | 98.5 /100 | #59 | Exceptional 48.4% |
| Immigrants | Romania | 98.5 /100 | #60 | Exceptional 48.4% |
| Romanians | 98.5 /100 | #61 | Exceptional 48.4% |
| Asians | 98.5 /100 | #62 | Exceptional 48.4% |
| Slavs | 98.3 /100 | #63 | Exceptional 48.4% |
| Immigrants | Czechoslovakia | 98.3 /100 | #64 | Exceptional 48.4% |
Demographics Similar to Eastern Europeans by Currently Married
In terms of currently married, the demographic groups most similar to Eastern Europeans are Polish (48.9%, a difference of 0.0%), Croatian (48.9%, a difference of 0.010%), Immigrants from Hong Kong (48.9%, a difference of 0.010%), Irish (48.9%, a difference of 0.050%), and Welsh (48.9%, a difference of 0.060%).
| Demographics | Rating | Rank | Currently Married |
| Immigrants | Pakistan | 99.7 /100 | #23 | Exceptional 49.1% |
| Lithuanians | 99.6 /100 | #24 | Exceptional 49.0% |
| Maltese | 99.6 /100 | #25 | Exceptional 49.0% |
| Immigrants | Korea | 99.6 /100 | #26 | Exceptional 49.0% |
| Burmese | 99.6 /100 | #27 | Exceptional 48.9% |
| Welsh | 99.5 /100 | #28 | Exceptional 48.9% |
| Croatians | 99.5 /100 | #29 | Exceptional 48.9% |
| Eastern Europeans | 99.5 /100 | #30 | Exceptional 48.9% |
| Poles | 99.5 /100 | #31 | Exceptional 48.9% |
| Immigrants | Hong Kong | 99.5 /100 | #32 | Exceptional 48.9% |
| Irish | 99.5 /100 | #33 | Exceptional 48.9% |
| Immigrants | Lithuania | 99.4 /100 | #34 | Exceptional 48.8% |
| Immigrants | Northern Europe | 99.4 /100 | #35 | Exceptional 48.8% |
| Italians | 99.4 /100 | #36 | Exceptional 48.8% |
| Hungarians | 99.4 /100 | #37 | Exceptional 48.8% |