Immigrants from Morocco vs Moroccan Median Family Income
COMPARE
Immigrants from Morocco
Moroccan
Median Family Income
Median Family Income Comparison
Immigrants from Morocco
Moroccans
$105,964
MEDIAN FAMILY INCOME
84.3/ 100
METRIC RATING
144th/ 347
METRIC RANK
$104,488
MEDIAN FAMILY INCOME
71.6/ 100
METRIC RATING
157th/ 347
METRIC RANK
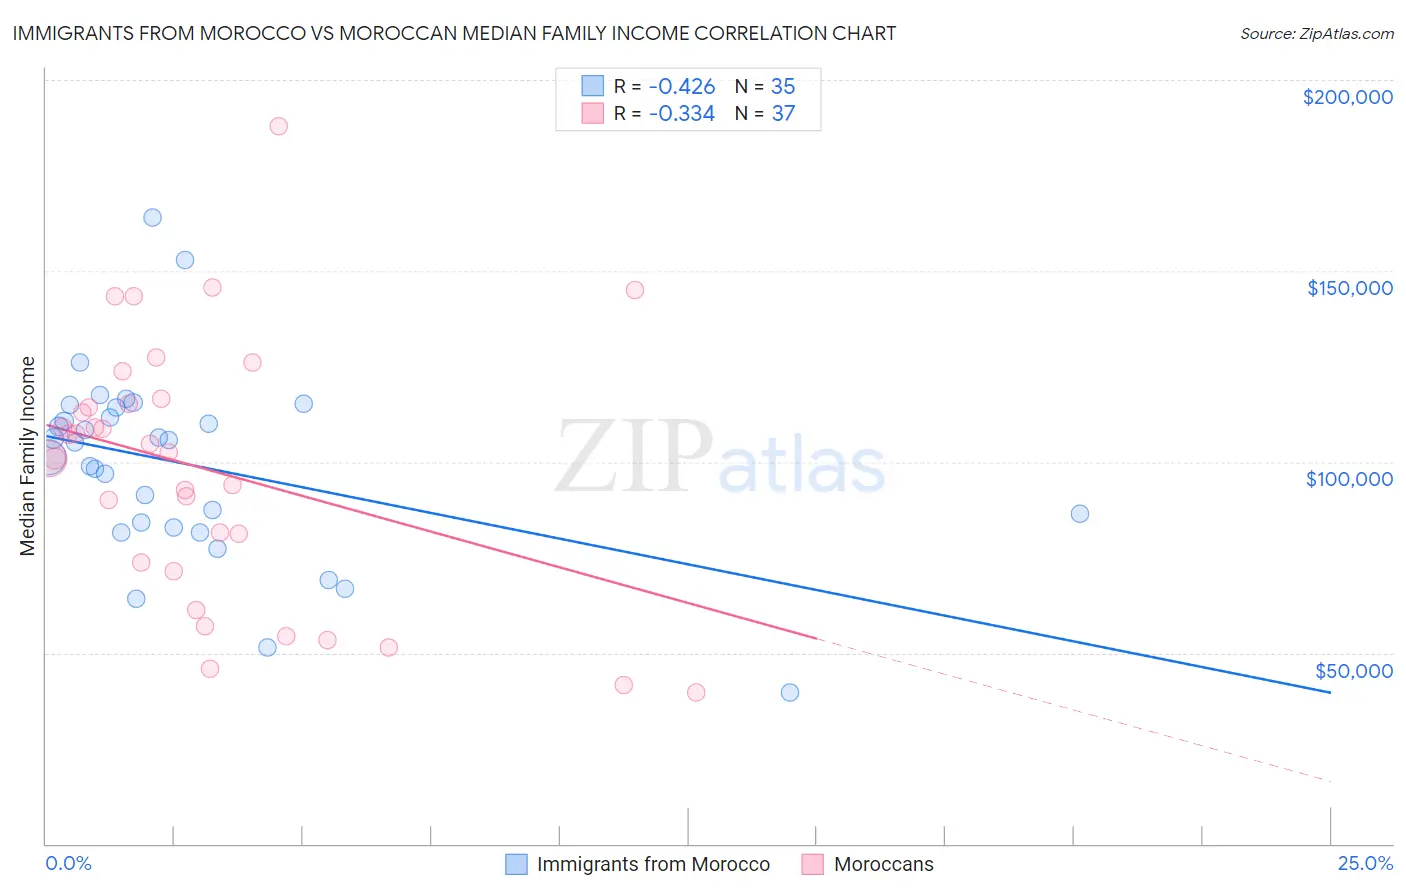
Immigrants from Morocco vs Moroccan Median Family Income Correlation Chart
The statistical analysis conducted on geographies consisting of 178,905,802 people shows a moderate negative correlation between the proportion of Immigrants from Morocco and median family income in the United States with a correlation coefficient (R) of -0.426 and weighted average of $105,964. Similarly, the statistical analysis conducted on geographies consisting of 201,715,101 people shows a mild negative correlation between the proportion of Moroccans and median family income in the United States with a correlation coefficient (R) of -0.334 and weighted average of $104,488, a difference of 1.4%.
Median Family Income Correlation Summary
| Measurement | Immigrants from Morocco | Moroccan |
| Minimum | $39,712 | $39,712 |
| Maximum | $163,880 | $187,788 |
| Range | $124,168 | $148,076 |
| Mean | $99,080 | $98,112 |
| Median | $105,156 | $102,324 |
| Interquartile 25% (IQ1) | $82,830 | $72,461 |
| Interquartile 75% (IQ3) | $114,323 | $115,754 |
| Interquartile Range (IQR) | $31,493 | $43,293 |
| Standard Deviation (Sample) | $24,961 | $33,816 |
| Standard Deviation (Population) | $24,602 | $33,356 |
Demographics Similar to Immigrants from Morocco and Moroccans by Median Family Income
In terms of median family income, the demographic groups most similar to Immigrants from Morocco are Tongan ($105,967, a difference of 0.0%), Slovene ($106,020, a difference of 0.050%), Danish ($105,900, a difference of 0.060%), Czech ($105,839, a difference of 0.12%), and Immigrants from Syria ($106,118, a difference of 0.15%). Similarly, the demographic groups most similar to Moroccans are Scandinavian ($104,410, a difference of 0.080%), Swiss ($104,396, a difference of 0.090%), Scottish ($104,288, a difference of 0.19%), Basque ($104,760, a difference of 0.26%), and Native Hawaiian ($104,910, a difference of 0.40%).
| Demographics | Rating | Rank | Median Family Income |
| Norwegians | 85.5 /100 | #140 | Excellent $106,144 |
| Immigrants | Syria | 85.3 /100 | #141 | Excellent $106,118 |
| Slovenes | 84.7 /100 | #142 | Excellent $106,020 |
| Tongans | 84.3 /100 | #143 | Excellent $105,967 |
| Immigrants | Morocco | 84.3 /100 | #144 | Excellent $105,964 |
| Danes | 83.8 /100 | #145 | Excellent $105,900 |
| Czechs | 83.4 /100 | #146 | Excellent $105,839 |
| Immigrants | Chile | 82.1 /100 | #147 | Excellent $105,655 |
| Hungarians | 81.7 /100 | #148 | Excellent $105,609 |
| Immigrants | Germany | 80.9 /100 | #149 | Excellent $105,507 |
| Irish | 80.5 /100 | #150 | Excellent $105,453 |
| Peruvians | 80.4 /100 | #151 | Excellent $105,444 |
| Immigrants | Albania | 79.1 /100 | #152 | Good $105,285 |
| Slavs | 77.9 /100 | #153 | Good $105,144 |
| Immigrants | Nepal | 76.3 /100 | #154 | Good $104,966 |
| Native Hawaiians | 75.8 /100 | #155 | Good $104,910 |
| Basques | 74.4 /100 | #156 | Good $104,760 |
| Moroccans | 71.6 /100 | #157 | Good $104,488 |
| Scandinavians | 70.8 /100 | #158 | Good $104,410 |
| Swiss | 70.7 /100 | #159 | Good $104,396 |
| Scottish | 69.5 /100 | #160 | Good $104,288 |