Immigrants from Moldova vs Immigrants from Western Europe Householder Income Ages 25 - 44 years
COMPARE
Immigrants from Moldova
Immigrants from Western Europe
Householder Income Ages 25 - 44 years
Householder Income Ages 25 - 44 years Comparison
Immigrants from Moldova
Immigrants from Western Europe
$101,091
HOUSEHOLDER INCOME AGES 25 - 44 YEARS
97.4/ 100
METRIC RATING
103rd/ 347
METRIC RANK
$102,654
HOUSEHOLDER INCOME AGES 25 - 44 YEARS
98.9/ 100
METRIC RATING
87th/ 347
METRIC RANK
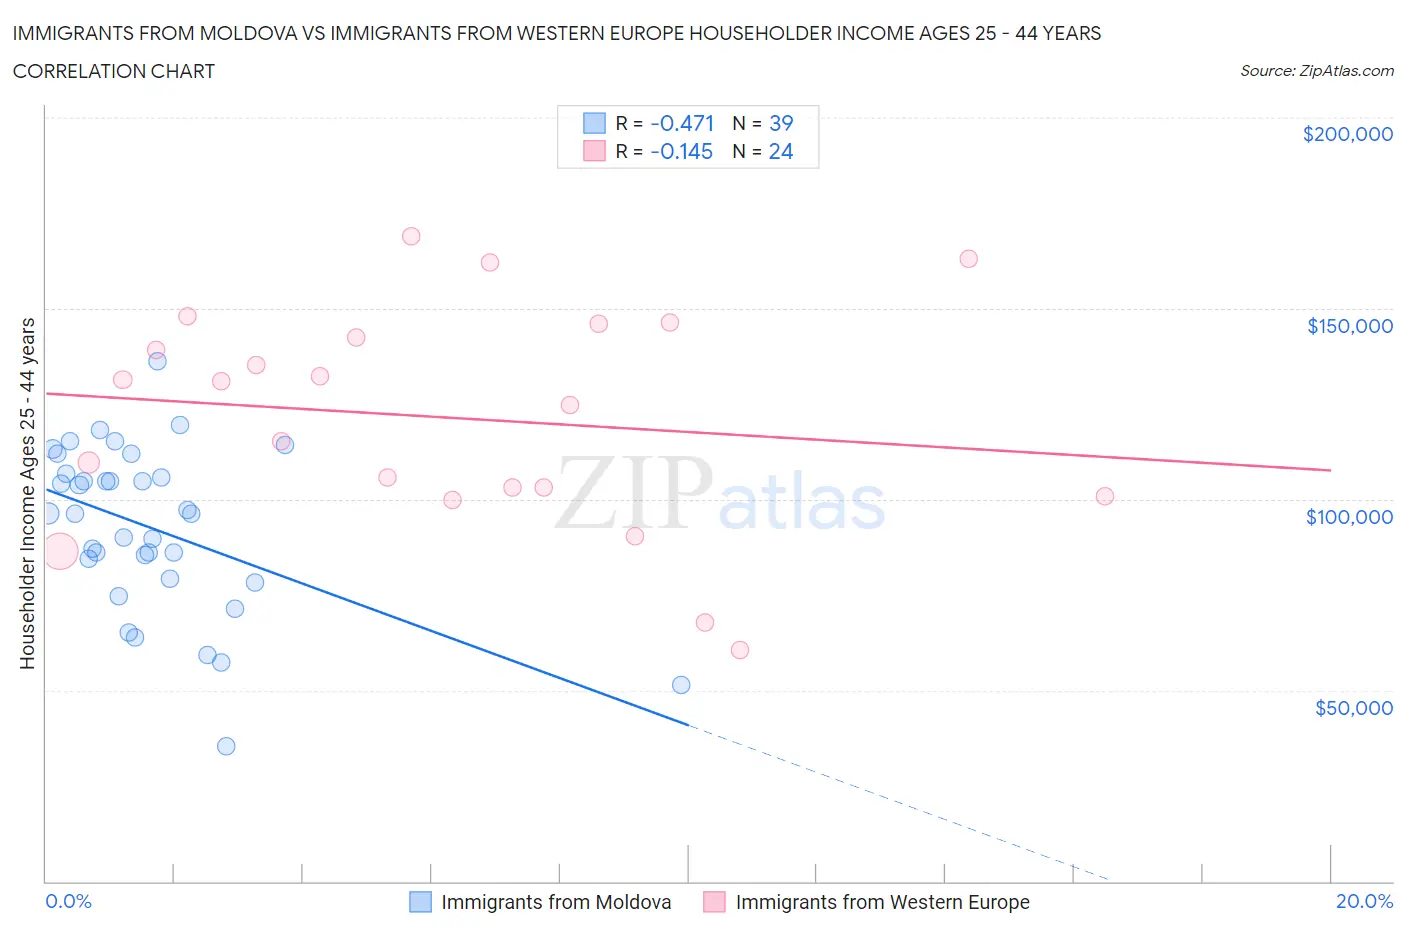
Immigrants from Moldova vs Immigrants from Western Europe Householder Income Ages 25 - 44 years Correlation Chart
The statistical analysis conducted on geographies consisting of 124,290,289 people shows a moderate negative correlation between the proportion of Immigrants from Moldova and household income with householder between the ages 25 and 44 in the United States with a correlation coefficient (R) of -0.471 and weighted average of $101,091. Similarly, the statistical analysis conducted on geographies consisting of 491,977,269 people shows a poor negative correlation between the proportion of Immigrants from Western Europe and household income with householder between the ages 25 and 44 in the United States with a correlation coefficient (R) of -0.145 and weighted average of $102,654, a difference of 1.5%.
Householder Income Ages 25 - 44 years Correlation Summary
| Measurement | Immigrants from Moldova | Immigrants from Western Europe |
| Minimum | $35,313 | $60,664 |
| Maximum | $136,071 | $169,009 |
| Range | $100,758 | $108,344 |
| Mean | $92,583 | $121,344 |
| Median | $96,188 | $127,790 |
| Interquartile 25% (IQ1) | $79,269 | $101,950 |
| Interquartile 75% (IQ3) | $106,700 | $144,131 |
| Interquartile Range (IQR) | $27,431 | $42,181 |
| Standard Deviation (Sample) | $21,518 | $29,174 |
| Standard Deviation (Population) | $21,240 | $28,560 |
Demographics Similar to Immigrants from Moldova and Immigrants from Western Europe by Householder Income Ages 25 - 44 years
In terms of householder income ages 25 - 44 years, the demographic groups most similar to Immigrants from Moldova are Immigrants from Lebanon ($101,124, a difference of 0.030%), Immigrants from Poland ($101,065, a difference of 0.030%), Albanian ($101,367, a difference of 0.27%), Immigrants from Argentina ($101,415, a difference of 0.32%), and Taiwanese ($101,492, a difference of 0.40%). Similarly, the demographic groups most similar to Immigrants from Western Europe are Immigrants from Hungary ($102,655, a difference of 0.0%), Immigrants from Ukraine ($102,664, a difference of 0.010%), Immigrants from Canada ($102,616, a difference of 0.040%), Romanian ($102,544, a difference of 0.11%), and Ukrainian ($102,451, a difference of 0.20%).
| Demographics | Rating | Rank | Householder Income Ages 25 - 44 years |
| Immigrants | Ukraine | 98.9 /100 | #85 | Exceptional $102,664 |
| Immigrants | Hungary | 98.9 /100 | #86 | Exceptional $102,655 |
| Immigrants | Western Europe | 98.9 /100 | #87 | Exceptional $102,654 |
| Immigrants | Canada | 98.9 /100 | #88 | Exceptional $102,616 |
| Romanians | 98.8 /100 | #89 | Exceptional $102,544 |
| Ukrainians | 98.8 /100 | #90 | Exceptional $102,451 |
| Croatians | 98.7 /100 | #91 | Exceptional $102,414 |
| Immigrants | North America | 98.7 /100 | #92 | Exceptional $102,407 |
| Immigrants | England | 98.4 /100 | #93 | Exceptional $102,020 |
| Sri Lankans | 98.4 /100 | #94 | Exceptional $101,960 |
| Assyrians/Chaldeans/Syriacs | 98.3 /100 | #95 | Exceptional $101,936 |
| Macedonians | 98.3 /100 | #96 | Exceptional $101,882 |
| Austrians | 98.3 /100 | #97 | Exceptional $101,842 |
| Immigrants | Kazakhstan | 98.1 /100 | #98 | Exceptional $101,727 |
| Taiwanese | 97.9 /100 | #99 | Exceptional $101,492 |
| Immigrants | Argentina | 97.8 /100 | #100 | Exceptional $101,415 |
| Albanians | 97.8 /100 | #101 | Exceptional $101,367 |
| Immigrants | Lebanon | 97.4 /100 | #102 | Exceptional $101,124 |
| Immigrants | Moldova | 97.4 /100 | #103 | Exceptional $101,091 |
| Immigrants | Poland | 97.4 /100 | #104 | Exceptional $101,065 |
| Immigrants | Vietnam | 96.5 /100 | #105 | Exceptional $100,535 |