Immigrants from Moldova vs Immigrants from Germany Householder Income Ages 25 - 44 years
COMPARE
Immigrants from Moldova
Immigrants from Germany
Householder Income Ages 25 - 44 years
Householder Income Ages 25 - 44 years Comparison
Immigrants from Moldova
Immigrants from Germany
$101,091
HOUSEHOLDER INCOME AGES 25 - 44 YEARS
97.4/ 100
METRIC RATING
103rd/ 347
METRIC RANK
$95,913
HOUSEHOLDER INCOME AGES 25 - 44 YEARS
67.9/ 100
METRIC RATING
156th/ 347
METRIC RANK
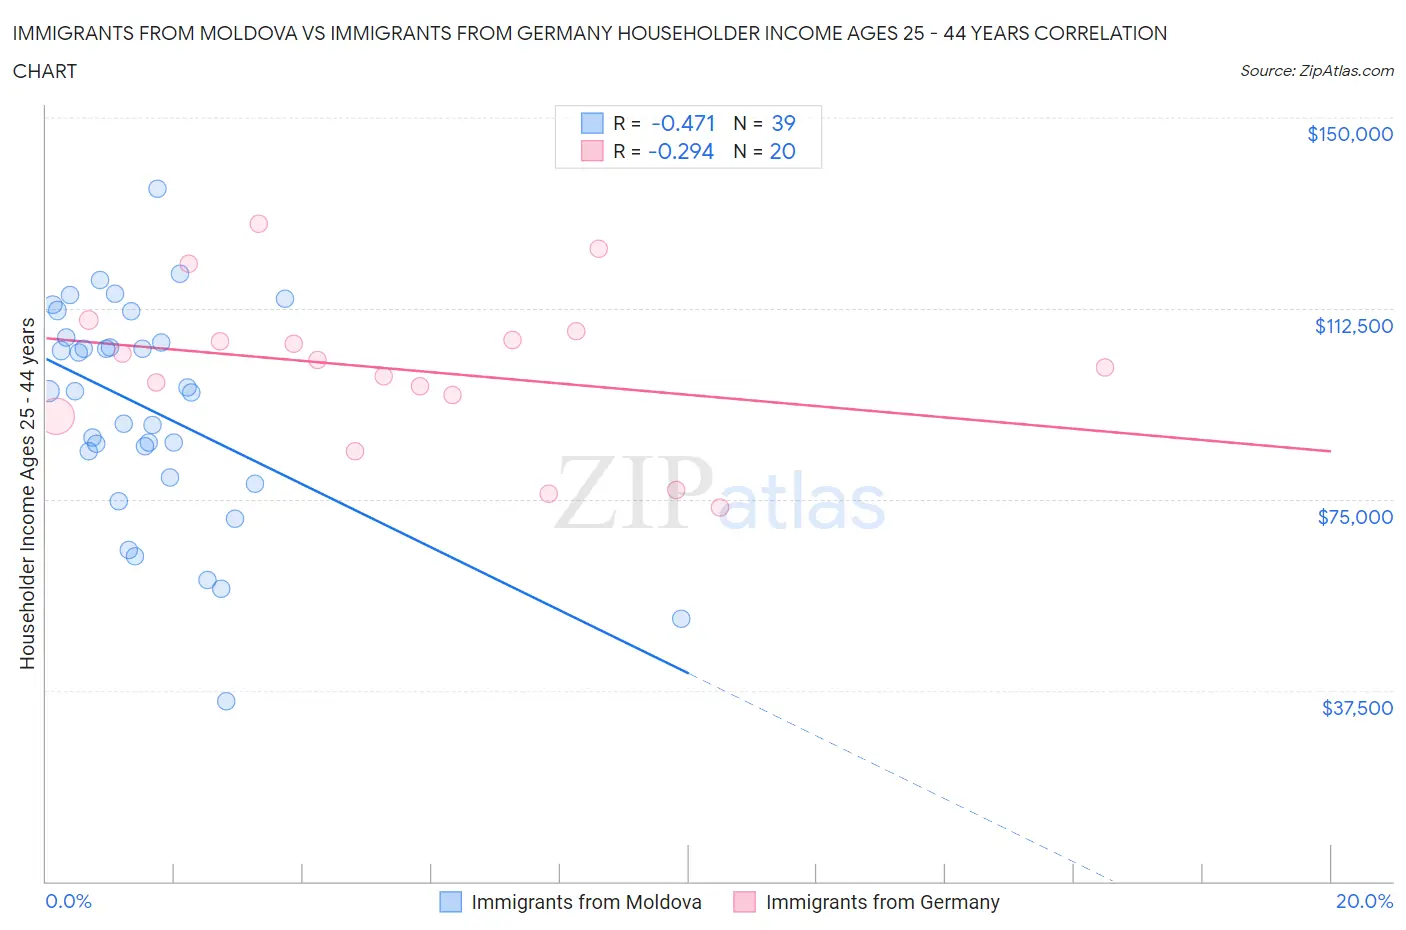
Immigrants from Moldova vs Immigrants from Germany Householder Income Ages 25 - 44 years Correlation Chart
The statistical analysis conducted on geographies consisting of 124,290,289 people shows a moderate negative correlation between the proportion of Immigrants from Moldova and household income with householder between the ages 25 and 44 in the United States with a correlation coefficient (R) of -0.471 and weighted average of $101,091. Similarly, the statistical analysis conducted on geographies consisting of 462,354,902 people shows a weak negative correlation between the proportion of Immigrants from Germany and household income with householder between the ages 25 and 44 in the United States with a correlation coefficient (R) of -0.294 and weighted average of $95,913, a difference of 5.4%.
Householder Income Ages 25 - 44 years Correlation Summary
| Measurement | Immigrants from Moldova | Immigrants from Germany |
| Minimum | $35,313 | $73,472 |
| Maximum | $136,071 | $129,121 |
| Range | $100,758 | $55,649 |
| Mean | $92,583 | $100,474 |
| Median | $96,188 | $101,592 |
| Interquartile 25% (IQ1) | $79,269 | $93,342 |
| Interquartile 75% (IQ3) | $106,700 | $107,107 |
| Interquartile Range (IQR) | $27,431 | $13,765 |
| Standard Deviation (Sample) | $21,518 | $15,097 |
| Standard Deviation (Population) | $21,240 | $14,715 |
Similar Demographics by Householder Income Ages 25 - 44 years
Demographics Similar to Immigrants from Moldova by Householder Income Ages 25 - 44 years
In terms of householder income ages 25 - 44 years, the demographic groups most similar to Immigrants from Moldova are Immigrants from Lebanon ($101,124, a difference of 0.030%), Immigrants from Poland ($101,065, a difference of 0.030%), Albanian ($101,367, a difference of 0.27%), Immigrants from Argentina ($101,415, a difference of 0.32%), and Taiwanese ($101,492, a difference of 0.40%).
| Demographics | Rating | Rank | Householder Income Ages 25 - 44 years |
| Macedonians | 98.3 /100 | #96 | Exceptional $101,882 |
| Austrians | 98.3 /100 | #97 | Exceptional $101,842 |
| Immigrants | Kazakhstan | 98.1 /100 | #98 | Exceptional $101,727 |
| Taiwanese | 97.9 /100 | #99 | Exceptional $101,492 |
| Immigrants | Argentina | 97.8 /100 | #100 | Exceptional $101,415 |
| Albanians | 97.8 /100 | #101 | Exceptional $101,367 |
| Immigrants | Lebanon | 97.4 /100 | #102 | Exceptional $101,124 |
| Immigrants | Moldova | 97.4 /100 | #103 | Exceptional $101,091 |
| Immigrants | Poland | 97.4 /100 | #104 | Exceptional $101,065 |
| Immigrants | Vietnam | 96.5 /100 | #105 | Exceptional $100,535 |
| Immigrants | Brazil | 96.5 /100 | #106 | Exceptional $100,534 |
| Northern Europeans | 96.3 /100 | #107 | Exceptional $100,457 |
| Immigrants | South Eastern Asia | 96.0 /100 | #108 | Exceptional $100,283 |
| Immigrants | North Macedonia | 95.6 /100 | #109 | Exceptional $100,101 |
| Immigrants | Afghanistan | 95.3 /100 | #110 | Exceptional $99,977 |
Demographics Similar to Immigrants from Germany by Householder Income Ages 25 - 44 years
In terms of householder income ages 25 - 44 years, the demographic groups most similar to Immigrants from Germany are Moroccan ($96,117, a difference of 0.21%), Immigrants from Uganda ($95,698, a difference of 0.22%), Scandinavian ($95,596, a difference of 0.33%), Costa Rican ($95,565, a difference of 0.36%), and Icelander ($95,560, a difference of 0.37%).
| Demographics | Rating | Rank | Householder Income Ages 25 - 44 years |
| Basques | 76.6 /100 | #149 | Good $96,709 |
| Ugandans | 76.2 /100 | #150 | Good $96,667 |
| Czechs | 74.8 /100 | #151 | Good $96,525 |
| South American Indians | 74.5 /100 | #152 | Good $96,497 |
| Slovenes | 73.9 /100 | #153 | Good $96,439 |
| Slavs | 73.2 /100 | #154 | Good $96,377 |
| Moroccans | 70.3 /100 | #155 | Good $96,117 |
| Immigrants | Germany | 67.9 /100 | #156 | Good $95,913 |
| Immigrants | Uganda | 65.2 /100 | #157 | Good $95,698 |
| Scandinavians | 63.9 /100 | #158 | Good $95,596 |
| Costa Ricans | 63.5 /100 | #159 | Good $95,565 |
| Icelanders | 63.4 /100 | #160 | Good $95,560 |
| Immigrants | Portugal | 62.8 /100 | #161 | Good $95,512 |
| Swiss | 62.8 /100 | #162 | Good $95,511 |
| Immigrants | Saudi Arabia | 62.0 /100 | #163 | Good $95,450 |