Immigrants from Moldova vs Central American Indian Median Female Earnings
COMPARE
Immigrants from Moldova
Central American Indian
Median Female Earnings
Median Female Earnings Comparison
Immigrants from Moldova
Central American Indians
$42,304
MEDIAN FEMALE EARNINGS
99.6/ 100
METRIC RATING
80th/ 347
METRIC RANK
$35,930
MEDIAN FEMALE EARNINGS
0.0/ 100
METRIC RATING
290th/ 347
METRIC RANK
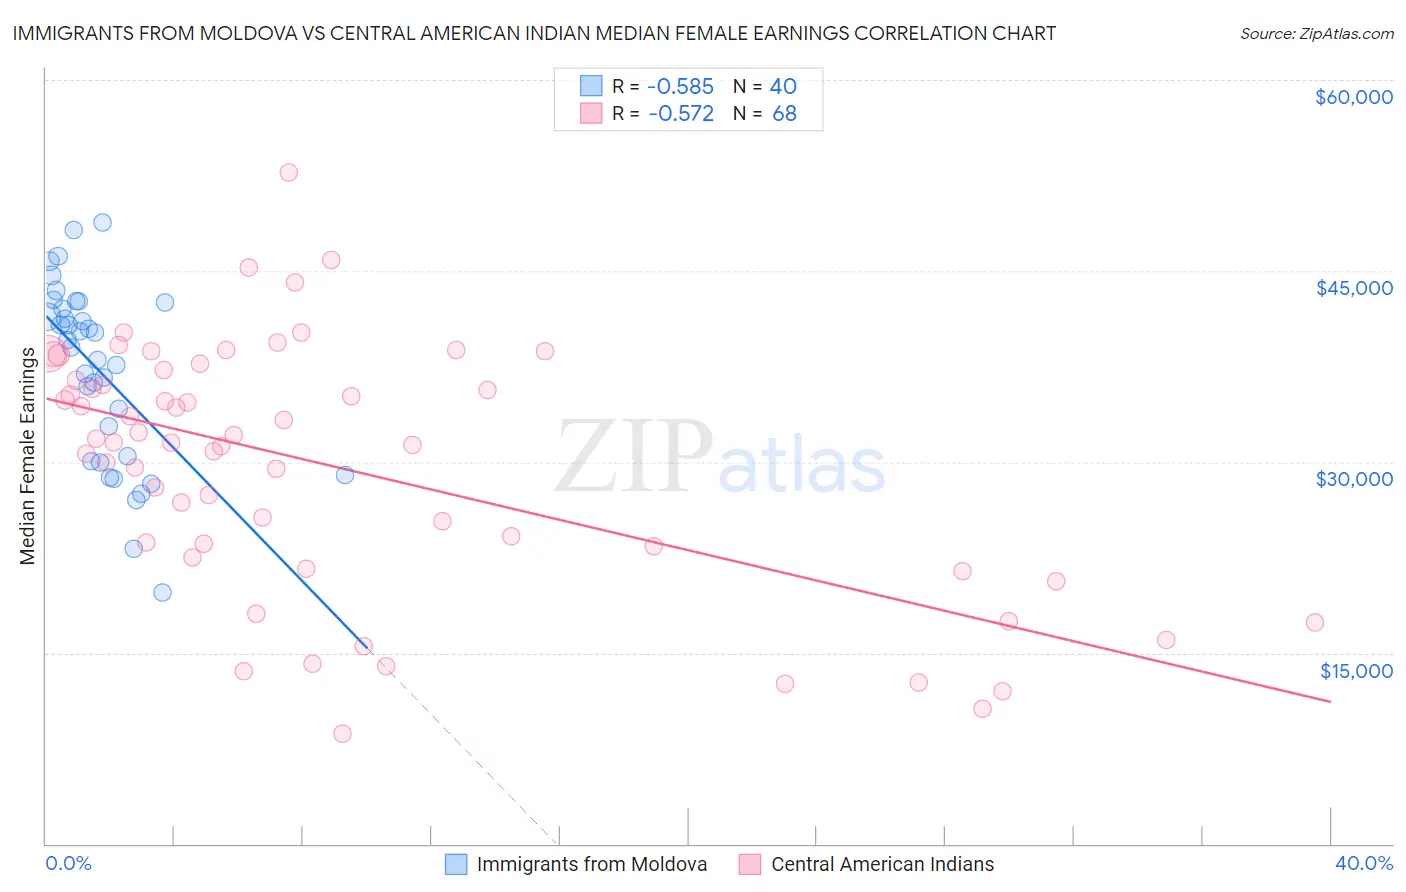
Immigrants from Moldova vs Central American Indian Median Female Earnings Correlation Chart
The statistical analysis conducted on geographies consisting of 124,390,401 people shows a substantial negative correlation between the proportion of Immigrants from Moldova and median female earnings in the United States with a correlation coefficient (R) of -0.585 and weighted average of $42,304. Similarly, the statistical analysis conducted on geographies consisting of 326,049,316 people shows a substantial negative correlation between the proportion of Central American Indians and median female earnings in the United States with a correlation coefficient (R) of -0.572 and weighted average of $35,930, a difference of 17.7%.
Median Female Earnings Correlation Summary
| Measurement | Immigrants from Moldova | Central American Indian |
| Minimum | $19,712 | $8,640 |
| Maximum | $48,785 | $52,708 |
| Range | $29,073 | $44,068 |
| Mean | $37,125 | $29,634 |
| Median | $39,287 | $31,554 |
| Interquartile 25% (IQ1) | $30,213 | $22,964 |
| Interquartile 75% (IQ3) | $42,291 | $36,801 |
| Interquartile Range (IQR) | $12,078 | $13,837 |
| Standard Deviation (Sample) | $7,033 | $9,825 |
| Standard Deviation (Population) | $6,945 | $9,752 |
Similar Demographics by Median Female Earnings
Demographics Similar to Immigrants from Moldova by Median Female Earnings
In terms of median female earnings, the demographic groups most similar to Immigrants from Moldova are Immigrants from Southern Europe ($42,275, a difference of 0.070%), Greek ($42,336, a difference of 0.080%), Immigrants from Morocco ($42,229, a difference of 0.18%), Immigrants from Kazakhstan ($42,386, a difference of 0.19%), and Immigrants from Albania ($42,388, a difference of 0.20%).
| Demographics | Rating | Rank | Median Female Earnings |
| Mongolians | 99.7 /100 | #73 | Exceptional $42,542 |
| Immigrants | South Africa | 99.7 /100 | #74 | Exceptional $42,508 |
| New Zealanders | 99.7 /100 | #75 | Exceptional $42,446 |
| Immigrants | Italy | 99.7 /100 | #76 | Exceptional $42,446 |
| Immigrants | Albania | 99.6 /100 | #77 | Exceptional $42,388 |
| Immigrants | Kazakhstan | 99.6 /100 | #78 | Exceptional $42,386 |
| Greeks | 99.6 /100 | #79 | Exceptional $42,336 |
| Immigrants | Moldova | 99.6 /100 | #80 | Exceptional $42,304 |
| Immigrants | Southern Europe | 99.5 /100 | #81 | Exceptional $42,275 |
| Immigrants | Morocco | 99.5 /100 | #82 | Exceptional $42,229 |
| Immigrants | Sierra Leone | 99.5 /100 | #83 | Exceptional $42,214 |
| Armenians | 99.5 /100 | #84 | Exceptional $42,212 |
| Laotians | 99.4 /100 | #85 | Exceptional $42,133 |
| Immigrants | St. Vincent and the Grenadines | 99.3 /100 | #86 | Exceptional $42,108 |
| Lithuanians | 99.3 /100 | #87 | Exceptional $42,108 |
Demographics Similar to Central American Indians by Median Female Earnings
In terms of median female earnings, the demographic groups most similar to Central American Indians are Bangladeshi ($35,960, a difference of 0.080%), Blackfeet ($35,864, a difference of 0.18%), Immigrants from Zaire ($36,017, a difference of 0.24%), Immigrants from Nicaragua ($36,023, a difference of 0.26%), and Osage ($36,034, a difference of 0.29%).
| Demographics | Rating | Rank | Median Female Earnings |
| Immigrants | Haiti | 0.1 /100 | #283 | Tragic $36,203 |
| Indonesians | 0.1 /100 | #284 | Tragic $36,140 |
| Paiute | 0.1 /100 | #285 | Tragic $36,056 |
| Osage | 0.0 /100 | #286 | Tragic $36,034 |
| Immigrants | Nicaragua | 0.0 /100 | #287 | Tragic $36,023 |
| Immigrants | Zaire | 0.0 /100 | #288 | Tragic $36,017 |
| Bangladeshis | 0.0 /100 | #289 | Tragic $35,960 |
| Central American Indians | 0.0 /100 | #290 | Tragic $35,930 |
| Blackfeet | 0.0 /100 | #291 | Tragic $35,864 |
| Americans | 0.0 /100 | #292 | Tragic $35,777 |
| Guatemalans | 0.0 /100 | #293 | Tragic $35,695 |
| Cheyenne | 0.0 /100 | #294 | Tragic $35,673 |
| Comanche | 0.0 /100 | #295 | Tragic $35,661 |
| Mexican American Indians | 0.0 /100 | #296 | Tragic $35,629 |
| Hmong | 0.0 /100 | #297 | Tragic $35,498 |