Canadian vs Immigrants from Nicaragua Householder Income Ages 25 - 44 years
COMPARE
Canadian
Immigrants from Nicaragua
Householder Income Ages 25 - 44 years
Householder Income Ages 25 - 44 years Comparison
Canadians
Immigrants from Nicaragua
$97,625
HOUSEHOLDER INCOME AGES 25 - 44 YEARS
84.5/ 100
METRIC RATING
134th/ 347
METRIC RANK
$84,914
HOUSEHOLDER INCOME AGES 25 - 44 YEARS
0.5/ 100
METRIC RATING
258th/ 347
METRIC RANK
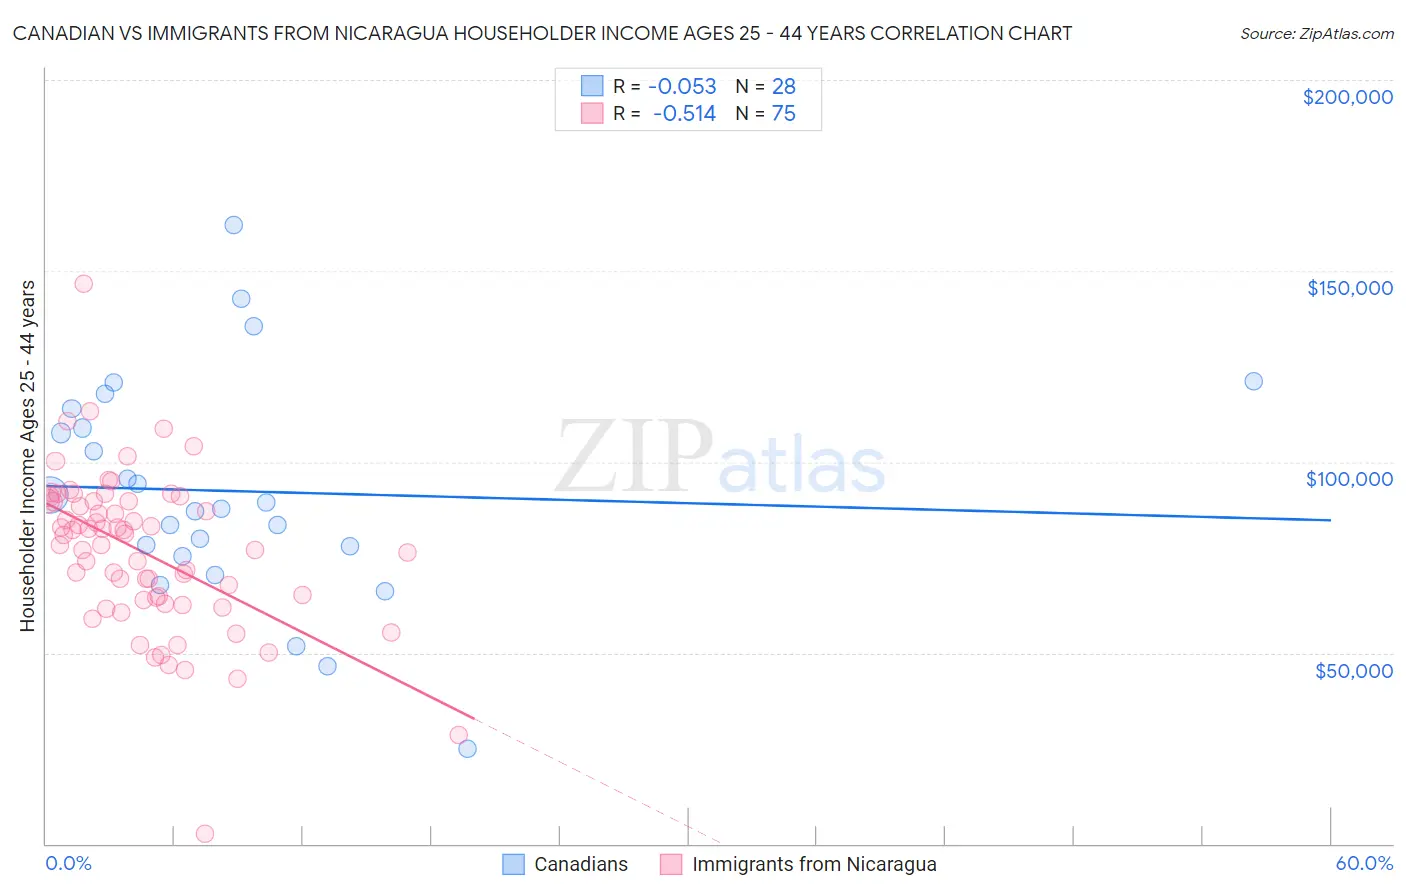
Canadian vs Immigrants from Nicaragua Householder Income Ages 25 - 44 years Correlation Chart
The statistical analysis conducted on geographies consisting of 435,952,621 people shows a slight negative correlation between the proportion of Canadians and household income with householder between the ages 25 and 44 in the United States with a correlation coefficient (R) of -0.053 and weighted average of $97,625. Similarly, the statistical analysis conducted on geographies consisting of 236,220,406 people shows a substantial negative correlation between the proportion of Immigrants from Nicaragua and household income with householder between the ages 25 and 44 in the United States with a correlation coefficient (R) of -0.514 and weighted average of $84,914, a difference of 15.0%.
Householder Income Ages 25 - 44 years Correlation Summary
| Measurement | Canadian | Immigrants from Nicaragua |
| Minimum | $24,946 | $2,499 |
| Maximum | $162,133 | $146,625 |
| Range | $137,187 | $144,126 |
| Mean | $92,304 | $76,575 |
| Median | $88,643 | $80,789 |
| Interquartile 25% (IQ1) | $76,629 | $63,671 |
| Interquartile 75% (IQ3) | $111,424 | $89,720 |
| Interquartile Range (IQR) | $34,795 | $26,048 |
| Standard Deviation (Sample) | $29,698 | $20,803 |
| Standard Deviation (Population) | $29,162 | $20,664 |
Similar Demographics by Householder Income Ages 25 - 44 years
Demographics Similar to Canadians by Householder Income Ages 25 - 44 years
In terms of householder income ages 25 - 44 years, the demographic groups most similar to Canadians are Immigrants from Oceania ($97,623, a difference of 0.0%), Hungarian ($97,544, a difference of 0.080%), Tsimshian ($97,809, a difference of 0.19%), Immigrants from Zimbabwe ($97,880, a difference of 0.26%), and Lebanese ($97,339, a difference of 0.29%).
| Demographics | Rating | Rank | Householder Income Ages 25 - 44 years |
| Serbians | 88.9 /100 | #127 | Excellent $98,320 |
| Europeans | 88.9 /100 | #128 | Excellent $98,310 |
| Brazilians | 88.6 /100 | #129 | Excellent $98,267 |
| Immigrants | Kuwait | 87.8 /100 | #130 | Excellent $98,122 |
| Immigrants | Albania | 86.6 /100 | #131 | Excellent $97,929 |
| Immigrants | Zimbabwe | 86.3 /100 | #132 | Excellent $97,880 |
| Tsimshian | 85.8 /100 | #133 | Excellent $97,809 |
| Canadians | 84.5 /100 | #134 | Excellent $97,625 |
| Immigrants | Oceania | 84.5 /100 | #135 | Excellent $97,623 |
| Hungarians | 83.9 /100 | #136 | Excellent $97,544 |
| Lebanese | 82.3 /100 | #137 | Excellent $97,339 |
| Arabs | 82.3 /100 | #138 | Excellent $97,336 |
| Immigrants | Peru | 82.2 /100 | #139 | Excellent $97,329 |
| Immigrants | Morocco | 82.0 /100 | #140 | Excellent $97,305 |
| Luxembourgers | 81.5 /100 | #141 | Excellent $97,237 |
Demographics Similar to Immigrants from Nicaragua by Householder Income Ages 25 - 44 years
In terms of householder income ages 25 - 44 years, the demographic groups most similar to Immigrants from Nicaragua are Immigrants from Senegal ($84,848, a difference of 0.080%), American ($84,791, a difference of 0.14%), Mexican American Indian ($85,066, a difference of 0.18%), Central American ($85,144, a difference of 0.27%), and Inupiat ($84,619, a difference of 0.35%).
| Demographics | Rating | Rank | Householder Income Ages 25 - 44 years |
| Cape Verdeans | 0.8 /100 | #251 | Tragic $85,758 |
| Immigrants | Western Africa | 0.7 /100 | #252 | Tragic $85,676 |
| British West Indians | 0.7 /100 | #253 | Tragic $85,565 |
| Immigrants | Laos | 0.7 /100 | #254 | Tragic $85,553 |
| German Russians | 0.6 /100 | #255 | Tragic $85,220 |
| Central Americans | 0.5 /100 | #256 | Tragic $85,144 |
| Mexican American Indians | 0.5 /100 | #257 | Tragic $85,066 |
| Immigrants | Nicaragua | 0.5 /100 | #258 | Tragic $84,914 |
| Immigrants | Senegal | 0.5 /100 | #259 | Tragic $84,848 |
| Americans | 0.4 /100 | #260 | Tragic $84,791 |
| Inupiat | 0.4 /100 | #261 | Tragic $84,619 |
| Cree | 0.4 /100 | #262 | Tragic $84,574 |
| Belizeans | 0.4 /100 | #263 | Tragic $84,534 |
| Osage | 0.4 /100 | #264 | Tragic $84,461 |
| Sudanese | 0.4 /100 | #265 | Tragic $84,401 |