Immigrants from Micronesia vs Immigrants from Brazil Wage/Income Gap
COMPARE
Immigrants from Micronesia
Immigrants from Brazil
Wage/Income Gap
Wage/Income Gap Comparison
Immigrants from Micronesia
Immigrants from Brazil
24.4%
WAGE/INCOME GAP
95.8/ 100
METRIC RATING
118th/ 347
METRIC RANK
27.0%
WAGE/INCOME GAP
5.0/ 100
METRIC RATING
233rd/ 347
METRIC RANK
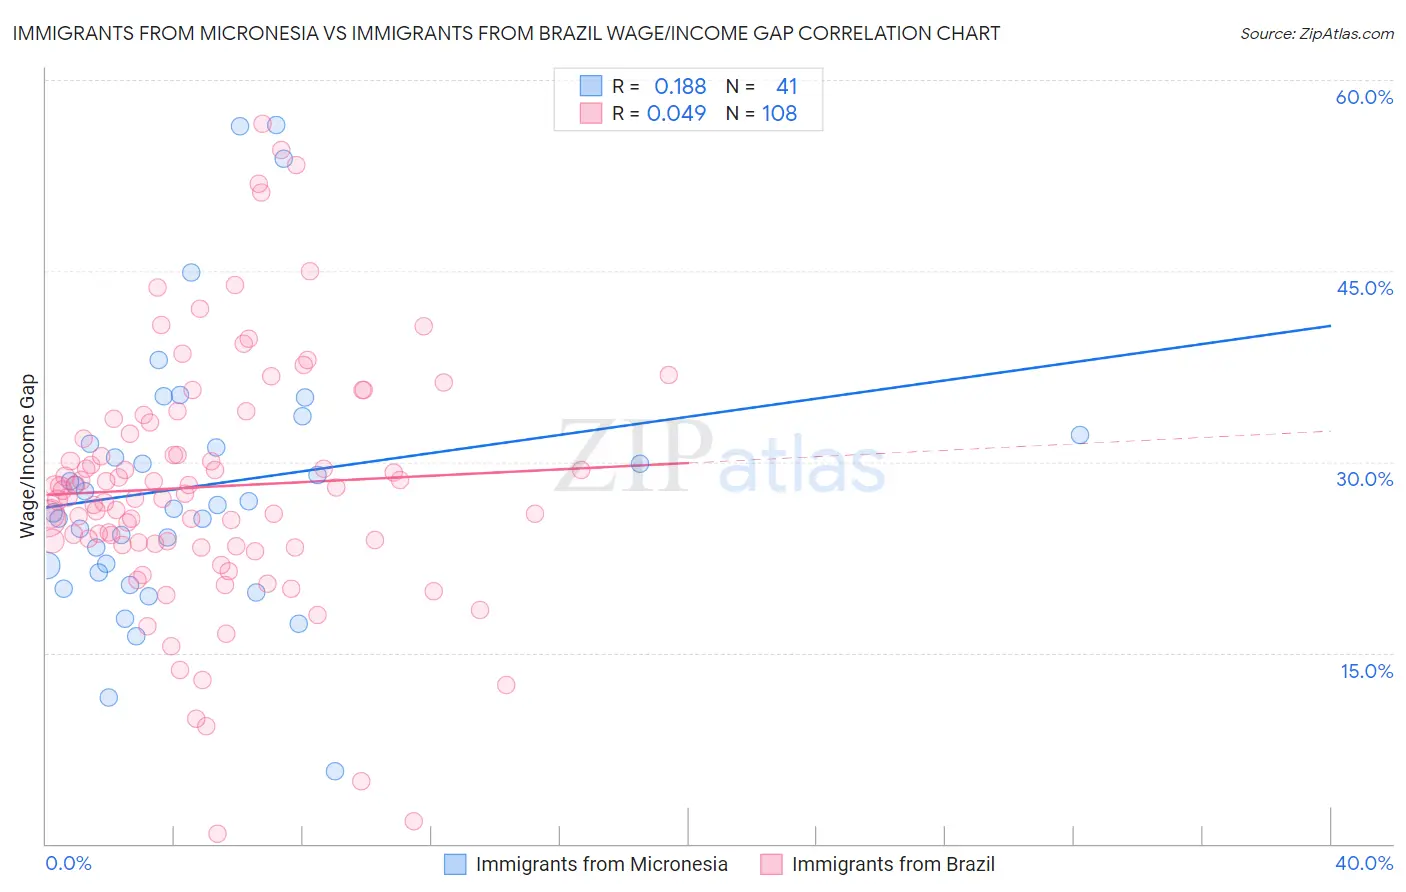
Immigrants from Micronesia vs Immigrants from Brazil Wage/Income Gap Correlation Chart
The statistical analysis conducted on geographies consisting of 61,599,093 people shows a poor positive correlation between the proportion of Immigrants from Micronesia and wage/income gap percentage in the United States with a correlation coefficient (R) of 0.188 and weighted average of 24.4%. Similarly, the statistical analysis conducted on geographies consisting of 342,853,162 people shows no correlation between the proportion of Immigrants from Brazil and wage/income gap percentage in the United States with a correlation coefficient (R) of 0.049 and weighted average of 27.0%, a difference of 10.4%.
Wage/Income Gap Correlation Summary
| Measurement | Immigrants from Micronesia | Immigrants from Brazil |
| Minimum | 5.7% | 0.81% |
| Maximum | 56.5% | 56.6% |
| Range | 50.8% | 55.7% |
| Mean | 28.1% | 28.0% |
| Median | 26.6% | 27.4% |
| Interquartile 25% (IQ1) | 21.6% | 23.5% |
| Interquartile 75% (IQ3) | 31.8% | 32.7% |
| Interquartile Range (IQR) | 10.1% | 9.2% |
| Standard Deviation (Sample) | 10.6% | 9.9% |
| Standard Deviation (Population) | 10.5% | 9.9% |
Similar Demographics by Wage/Income Gap
Demographics Similar to Immigrants from Micronesia by Wage/Income Gap
In terms of wage/income gap, the demographic groups most similar to Immigrants from Micronesia are Kenyan (24.5%, a difference of 0.020%), Immigrants from Afghanistan (24.4%, a difference of 0.030%), Alaska Native (24.4%, a difference of 0.090%), Cree (24.5%, a difference of 0.090%), and Immigrants from Kenya (24.4%, a difference of 0.26%).
| Demographics | Rating | Rank | Wage/Income Gap |
| Soviet Union | 97.6 /100 | #111 | Exceptional 24.2% |
| Immigrants | Colombia | 97.0 /100 | #112 | Exceptional 24.3% |
| Sioux | 96.9 /100 | #113 | Exceptional 24.3% |
| Panamanians | 96.5 /100 | #114 | Exceptional 24.4% |
| Immigrants | Kenya | 96.4 /100 | #115 | Exceptional 24.4% |
| Alaska Natives | 96.0 /100 | #116 | Exceptional 24.4% |
| Immigrants | Afghanistan | 95.9 /100 | #117 | Exceptional 24.4% |
| Immigrants | Micronesia | 95.8 /100 | #118 | Exceptional 24.4% |
| Kenyans | 95.8 /100 | #119 | Exceptional 24.5% |
| Cree | 95.6 /100 | #120 | Exceptional 24.5% |
| Immigrants | Thailand | 94.9 /100 | #121 | Exceptional 24.5% |
| Apache | 94.8 /100 | #122 | Exceptional 24.5% |
| Natives/Alaskans | 94.6 /100 | #123 | Exceptional 24.6% |
| Immigrants | South America | 93.9 /100 | #124 | Exceptional 24.6% |
| Spanish Americans | 93.8 /100 | #125 | Exceptional 24.6% |
Demographics Similar to Immigrants from Brazil by Wage/Income Gap
In terms of wage/income gap, the demographic groups most similar to Immigrants from Brazil are Immigrants from Pakistan (27.0%, a difference of 0.050%), Argentinean (27.0%, a difference of 0.060%), Immigrants from Hungary (27.0%, a difference of 0.060%), Bhutanese (27.0%, a difference of 0.080%), and Immigrants from Romania (27.0%, a difference of 0.080%).
| Demographics | Rating | Rank | Wage/Income Gap |
| Asians | 5.9 /100 | #226 | Tragic 26.9% |
| Spaniards | 5.6 /100 | #227 | Tragic 27.0% |
| Immigrants | Turkey | 5.6 /100 | #228 | Tragic 27.0% |
| Immigrants | Asia | 5.5 /100 | #229 | Tragic 27.0% |
| Ottawa | 5.3 /100 | #230 | Tragic 27.0% |
| Bhutanese | 5.3 /100 | #231 | Tragic 27.0% |
| Argentineans | 5.2 /100 | #232 | Tragic 27.0% |
| Immigrants | Brazil | 5.0 /100 | #233 | Tragic 27.0% |
| Immigrants | Pakistan | 4.9 /100 | #234 | Tragic 27.0% |
| Immigrants | Hungary | 4.8 /100 | #235 | Tragic 27.0% |
| Immigrants | Romania | 4.8 /100 | #236 | Tragic 27.0% |
| Immigrants | Eastern Asia | 4.4 /100 | #237 | Tragic 27.1% |
| Osage | 4.4 /100 | #238 | Tragic 27.1% |
| Estonians | 4.3 /100 | #239 | Tragic 27.1% |
| Immigrants | Europe | 3.8 /100 | #240 | Tragic 27.1% |