Immigrants from Micronesia vs Ethiopian High School Diploma
COMPARE
Immigrants from Micronesia
Ethiopian
High School Diploma
High School Diploma Comparison
Immigrants from Micronesia
Ethiopians
88.6%
HIGH SCHOOL DIPLOMA
16.4/ 100
METRIC RATING
205th/ 347
METRIC RANK
89.0%
HIGH SCHOOL DIPLOMA
37.0/ 100
METRIC RATING
185th/ 347
METRIC RANK
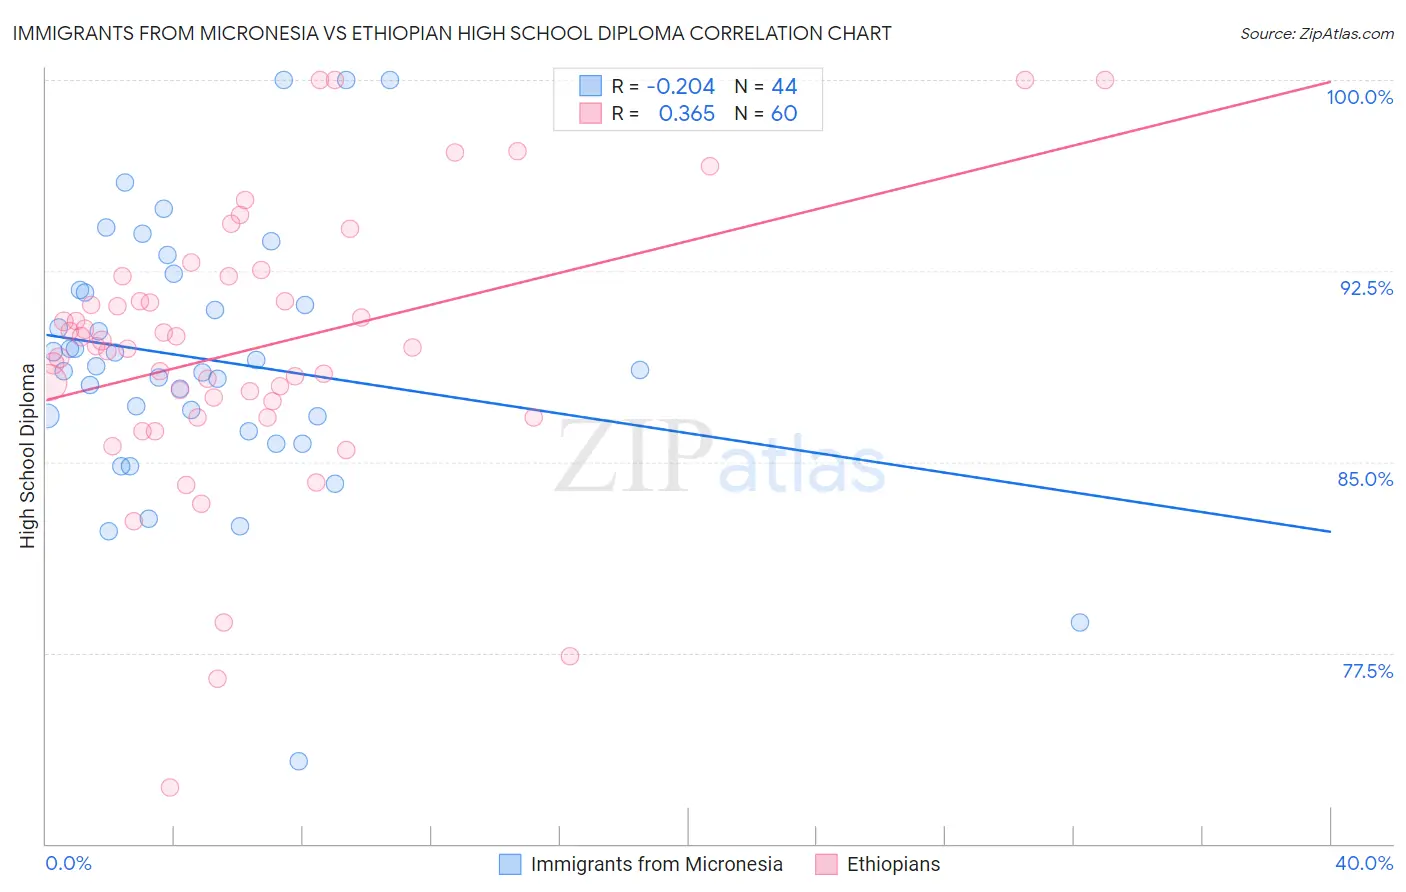
Immigrants from Micronesia vs Ethiopian High School Diploma Correlation Chart
The statistical analysis conducted on geographies consisting of 61,609,499 people shows a weak negative correlation between the proportion of Immigrants from Micronesia and percentage of population with at least high school diploma education in the United States with a correlation coefficient (R) of -0.204 and weighted average of 88.6%. Similarly, the statistical analysis conducted on geographies consisting of 223,235,367 people shows a mild positive correlation between the proportion of Ethiopians and percentage of population with at least high school diploma education in the United States with a correlation coefficient (R) of 0.365 and weighted average of 89.0%, a difference of 0.42%.
High School Diploma Correlation Summary
| Measurement | Immigrants from Micronesia | Ethiopian |
| Minimum | 73.2% | 72.2% |
| Maximum | 100.0% | 100.0% |
| Range | 26.8% | 27.8% |
| Mean | 89.0% | 89.4% |
| Median | 88.7% | 89.5% |
| Interquartile 25% (IQ1) | 86.5% | 87.1% |
| Interquartile 75% (IQ3) | 91.7% | 91.8% |
| Interquartile Range (IQR) | 5.2% | 4.7% |
| Standard Deviation (Sample) | 5.2% | 5.4% |
| Standard Deviation (Population) | 5.1% | 5.4% |
Demographics Similar to Immigrants from Micronesia and Ethiopians by High School Diploma
In terms of high school diploma, the demographic groups most similar to Immigrants from Micronesia are Armenian (88.6%, a difference of 0.020%), Somali (88.6%, a difference of 0.030%), Panamanian (88.6%, a difference of 0.040%), Hawaiian (88.6%, a difference of 0.050%), and Korean (88.6%, a difference of 0.050%). Similarly, the demographic groups most similar to Ethiopians are Immigrants from Eastern Africa (88.9%, a difference of 0.020%), Guamanian/Chamorro (88.9%, a difference of 0.020%), Immigrants from Sudan (88.9%, a difference of 0.060%), Immigrants from Uganda (88.9%, a difference of 0.070%), and Immigrants from Chile (88.9%, a difference of 0.090%).
| Demographics | Rating | Rank | High School Diploma |
| Ethiopians | 37.0 /100 | #185 | Fair 89.0% |
| Immigrants | Eastern Africa | 35.8 /100 | #186 | Fair 88.9% |
| Guamanians/Chamorros | 35.5 /100 | #187 | Fair 88.9% |
| Immigrants | Sudan | 33.4 /100 | #188 | Fair 88.9% |
| Immigrants | Uganda | 32.6 /100 | #189 | Fair 88.9% |
| Immigrants | Chile | 31.9 /100 | #190 | Fair 88.9% |
| Immigrants | Ethiopia | 30.9 /100 | #191 | Fair 88.9% |
| Moroccans | 29.5 /100 | #192 | Fair 88.8% |
| Immigrants | Oceania | 26.9 /100 | #193 | Fair 88.8% |
| Immigrants | Venezuela | 25.8 /100 | #194 | Fair 88.8% |
| Afghans | 23.9 /100 | #195 | Fair 88.8% |
| Immigrants | Southern Europe | 23.4 /100 | #196 | Fair 88.7% |
| French American Indians | 21.5 /100 | #197 | Fair 88.7% |
| Liberians | 18.8 /100 | #198 | Poor 88.7% |
| Marshallese | 18.7 /100 | #199 | Poor 88.6% |
| Hawaiians | 18.3 /100 | #200 | Poor 88.6% |
| Koreans | 18.1 /100 | #201 | Poor 88.6% |
| Panamanians | 18.0 /100 | #202 | Poor 88.6% |
| Somalis | 17.5 /100 | #203 | Poor 88.6% |
| Armenians | 17.2 /100 | #204 | Poor 88.6% |
| Immigrants | Micronesia | 16.4 /100 | #205 | Poor 88.6% |