Immigrants from Micronesia vs Ethiopian Median Household Income
COMPARE
Immigrants from Micronesia
Ethiopian
Median Household Income
Median Household Income Comparison
Immigrants from Micronesia
Ethiopians
$75,574
MEDIAN HOUSEHOLD INCOME
0.2/ 100
METRIC RATING
275th/ 347
METRIC RANK
$89,640
MEDIAN HOUSEHOLD INCOME
94.9/ 100
METRIC RATING
121st/ 347
METRIC RANK
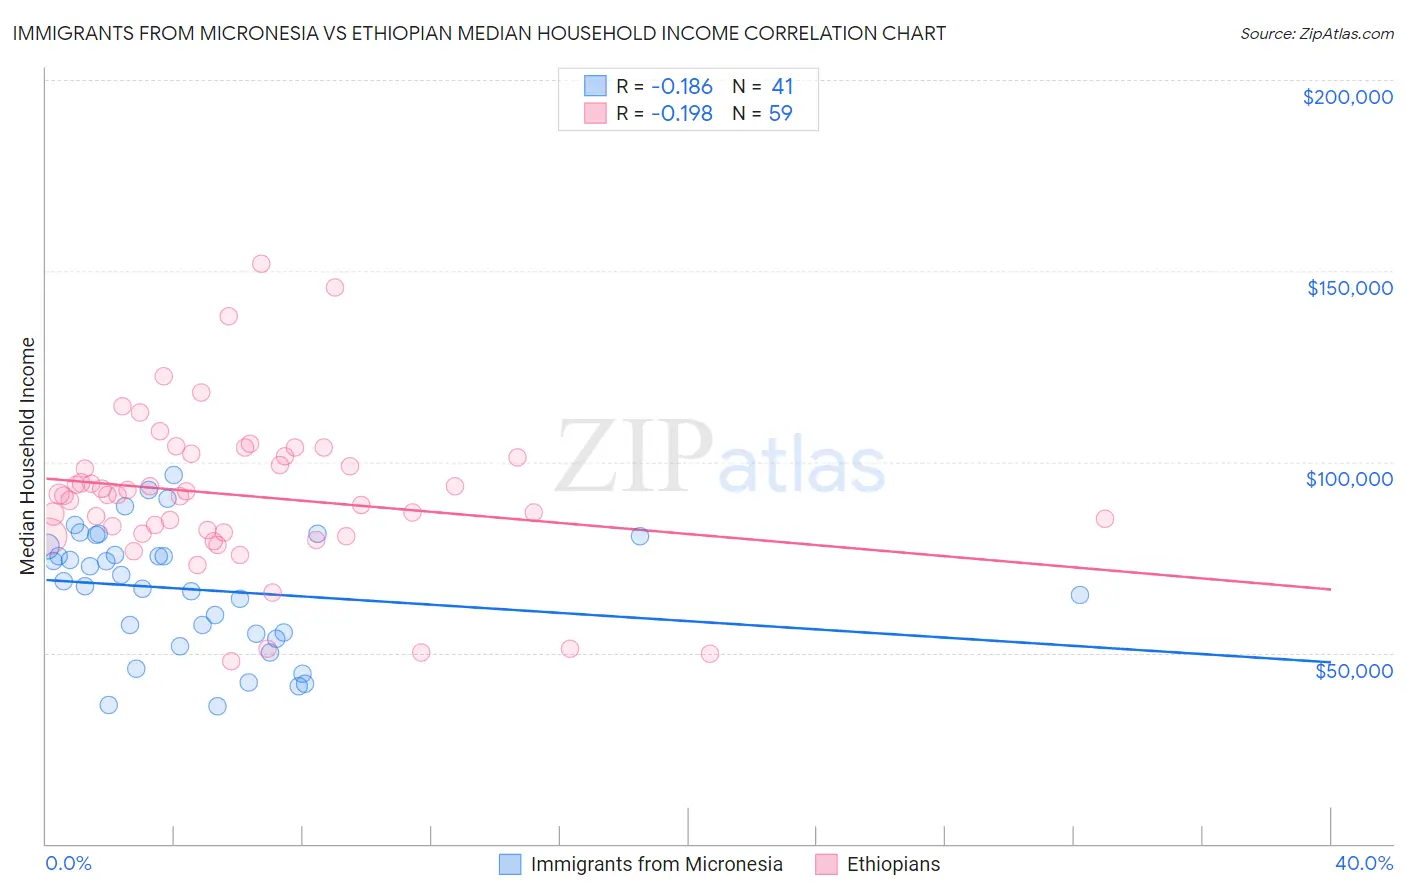
Immigrants from Micronesia vs Ethiopian Median Household Income Correlation Chart
The statistical analysis conducted on geographies consisting of 61,597,439 people shows a poor negative correlation between the proportion of Immigrants from Micronesia and median household income in the United States with a correlation coefficient (R) of -0.186 and weighted average of $75,574. Similarly, the statistical analysis conducted on geographies consisting of 223,045,474 people shows a poor negative correlation between the proportion of Ethiopians and median household income in the United States with a correlation coefficient (R) of -0.198 and weighted average of $89,640, a difference of 18.6%.
Median Household Income Correlation Summary
| Measurement | Immigrants from Micronesia | Ethiopian |
| Minimum | $36,071 | $47,668 |
| Maximum | $96,614 | $151,943 |
| Range | $60,543 | $104,275 |
| Mean | $66,523 | $91,215 |
| Median | $68,636 | $91,248 |
| Interquartile 25% (IQ1) | $54,388 | $81,124 |
| Interquartile 75% (IQ3) | $79,184 | $101,374 |
| Interquartile Range (IQR) | $24,796 | $20,250 |
| Standard Deviation (Sample) | $16,084 | $20,515 |
| Standard Deviation (Population) | $15,887 | $20,340 |
Similar Demographics by Median Household Income
Demographics Similar to Immigrants from Micronesia by Median Household Income
In terms of median household income, the demographic groups most similar to Immigrants from Micronesia are British West Indian ($75,647, a difference of 0.10%), Liberian ($75,667, a difference of 0.12%), Immigrants from Latin America ($75,420, a difference of 0.20%), Spanish American ($75,386, a difference of 0.25%), and Somali ($75,782, a difference of 0.27%).
| Demographics | Rating | Rank | Median Household Income |
| Immigrants | Jamaica | 0.3 /100 | #268 | Tragic $75,851 |
| Cape Verdeans | 0.3 /100 | #269 | Tragic $75,848 |
| Hmong | 0.3 /100 | #270 | Tragic $75,839 |
| Pennsylvania Germans | 0.3 /100 | #271 | Tragic $75,814 |
| Somalis | 0.3 /100 | #272 | Tragic $75,782 |
| Liberians | 0.2 /100 | #273 | Tragic $75,667 |
| British West Indians | 0.2 /100 | #274 | Tragic $75,647 |
| Immigrants | Micronesia | 0.2 /100 | #275 | Tragic $75,574 |
| Immigrants | Latin America | 0.2 /100 | #276 | Tragic $75,420 |
| Spanish Americans | 0.2 /100 | #277 | Tragic $75,386 |
| Osage | 0.2 /100 | #278 | Tragic $75,240 |
| Immigrants | Guatemala | 0.2 /100 | #279 | Tragic $75,123 |
| Senegalese | 0.2 /100 | #280 | Tragic $74,999 |
| Immigrants | Liberia | 0.1 /100 | #281 | Tragic $74,896 |
| Central American Indians | 0.1 /100 | #282 | Tragic $74,847 |
Demographics Similar to Ethiopians by Median Household Income
In terms of median household income, the demographic groups most similar to Ethiopians are Pakistani ($89,638, a difference of 0.0%), Immigrants from North Macedonia ($89,741, a difference of 0.11%), Albanian ($89,744, a difference of 0.12%), Immigrants from Zimbabwe ($89,496, a difference of 0.16%), and Syrian ($89,830, a difference of 0.21%).
| Demographics | Rating | Rank | Median Household Income |
| Immigrants | Northern Africa | 95.9 /100 | #114 | Exceptional $90,026 |
| Immigrants | Western Asia | 95.9 /100 | #115 | Exceptional $90,005 |
| Native Hawaiians | 95.7 /100 | #116 | Exceptional $89,919 |
| Taiwanese | 95.6 /100 | #117 | Exceptional $89,900 |
| Syrians | 95.4 /100 | #118 | Exceptional $89,830 |
| Albanians | 95.2 /100 | #119 | Exceptional $89,744 |
| Immigrants | North Macedonia | 95.2 /100 | #120 | Exceptional $89,741 |
| Ethiopians | 94.9 /100 | #121 | Exceptional $89,640 |
| Pakistanis | 94.8 /100 | #122 | Exceptional $89,638 |
| Immigrants | Zimbabwe | 94.4 /100 | #123 | Exceptional $89,496 |
| Immigrants | Jordan | 94.1 /100 | #124 | Exceptional $89,412 |
| Immigrants | Kuwait | 93.5 /100 | #125 | Exceptional $89,263 |
| Immigrants | Oceania | 92.9 /100 | #126 | Exceptional $89,100 |
| Immigrants | Peru | 92.5 /100 | #127 | Exceptional $89,010 |
| Portuguese | 92.3 /100 | #128 | Exceptional $88,976 |