Immigrants from Mexico vs Alsatian Median Female Earnings
COMPARE
Immigrants from Mexico
Alsatian
Median Female Earnings
Median Female Earnings Comparison
Immigrants from Mexico
Alsatians
$33,236
MEDIAN FEMALE EARNINGS
0.0/ 100
METRIC RATING
339th/ 347
METRIC RANK
$40,060
MEDIAN FEMALE EARNINGS
68.0/ 100
METRIC RATING
161st/ 347
METRIC RANK
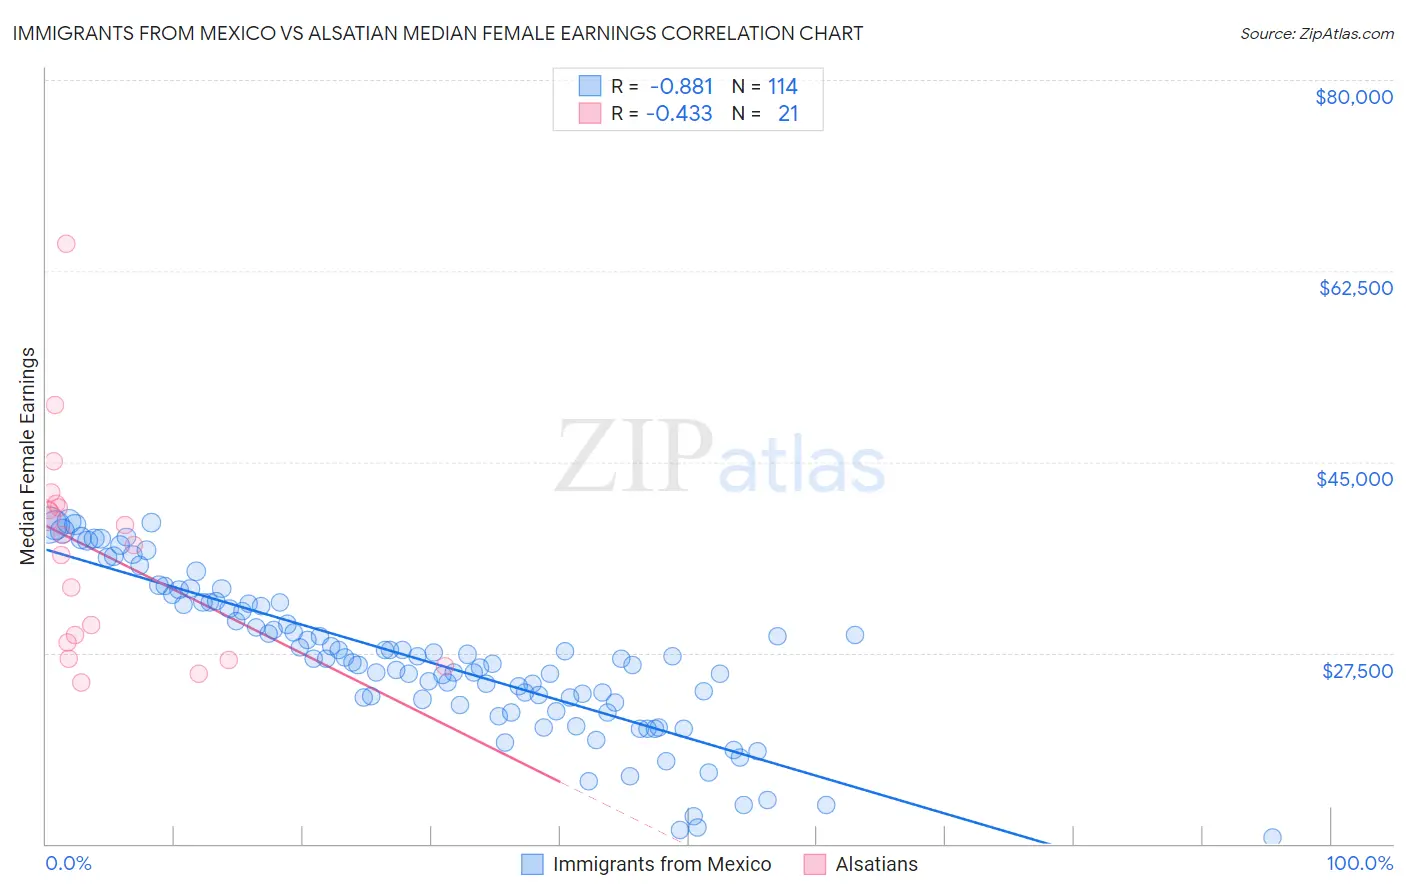
Immigrants from Mexico vs Alsatian Median Female Earnings Correlation Chart
The statistical analysis conducted on geographies consisting of 512,787,138 people shows a very strong negative correlation between the proportion of Immigrants from Mexico and median female earnings in the United States with a correlation coefficient (R) of -0.881 and weighted average of $33,236. Similarly, the statistical analysis conducted on geographies consisting of 82,671,266 people shows a moderate negative correlation between the proportion of Alsatians and median female earnings in the United States with a correlation coefficient (R) of -0.433 and weighted average of $40,060, a difference of 20.5%.
Median Female Earnings Correlation Summary
| Measurement | Immigrants from Mexico | Alsatian |
| Minimum | $10,532 | $24,833 |
| Maximum | $39,508 | $65,000 |
| Range | $28,976 | $40,167 |
| Mean | $26,933 | $36,577 |
| Median | $26,949 | $37,425 |
| Interquartile 25% (IQ1) | $22,999 | $27,720 |
| Interquartile 75% (IQ3) | $32,002 | $40,989 |
| Interquartile Range (IQR) | $9,003 | $13,268 |
| Standard Deviation (Sample) | $6,963 | $9,753 |
| Standard Deviation (Population) | $6,932 | $9,518 |
Similar Demographics by Median Female Earnings
Demographics Similar to Immigrants from Mexico by Median Female Earnings
In terms of median female earnings, the demographic groups most similar to Immigrants from Mexico are Tohono O'odham ($33,205, a difference of 0.090%), Immigrants from Cuba ($33,291, a difference of 0.17%), Yakama ($33,354, a difference of 0.36%), Ottawa ($33,378, a difference of 0.43%), and Navajo ($33,046, a difference of 0.57%).
| Demographics | Rating | Rank | Median Female Earnings |
| Choctaw | 0.0 /100 | #332 | Tragic $33,775 |
| Mexicans | 0.0 /100 | #333 | Tragic $33,664 |
| Spanish American Indians | 0.0 /100 | #334 | Tragic $33,625 |
| Creek | 0.0 /100 | #335 | Tragic $33,437 |
| Ottawa | 0.0 /100 | #336 | Tragic $33,378 |
| Yakama | 0.0 /100 | #337 | Tragic $33,354 |
| Immigrants | Cuba | 0.0 /100 | #338 | Tragic $33,291 |
| Immigrants | Mexico | 0.0 /100 | #339 | Tragic $33,236 |
| Tohono O'odham | 0.0 /100 | #340 | Tragic $33,205 |
| Navajo | 0.0 /100 | #341 | Tragic $33,046 |
| Yup'ik | 0.0 /100 | #342 | Tragic $32,730 |
| Pueblo | 0.0 /100 | #343 | Tragic $32,564 |
| Lumbee | 0.0 /100 | #344 | Tragic $32,500 |
| Puerto Ricans | 0.0 /100 | #345 | Tragic $31,560 |
| Arapaho | 0.0 /100 | #346 | Tragic $31,489 |
Demographics Similar to Alsatians by Median Female Earnings
In terms of median female earnings, the demographic groups most similar to Alsatians are Inupiat ($40,080, a difference of 0.050%), South American Indian ($40,019, a difference of 0.10%), Lebanese ($40,006, a difference of 0.14%), Immigrants from Vietnam ($40,153, a difference of 0.23%), and Immigrants from Senegal ($40,157, a difference of 0.24%).
| Demographics | Rating | Rank | Median Female Earnings |
| Immigrants | Oceania | 77.6 /100 | #154 | Good $40,297 |
| Immigrants | Africa | 76.2 /100 | #155 | Good $40,257 |
| Peruvians | 75.3 /100 | #156 | Good $40,234 |
| Portuguese | 73.0 /100 | #157 | Good $40,177 |
| Immigrants | Senegal | 72.2 /100 | #158 | Good $40,157 |
| Immigrants | Vietnam | 72.0 /100 | #159 | Good $40,153 |
| Inupiat | 68.9 /100 | #160 | Good $40,080 |
| Alsatians | 68.0 /100 | #161 | Good $40,060 |
| South American Indians | 66.1 /100 | #162 | Good $40,019 |
| Lebanese | 65.5 /100 | #163 | Good $40,006 |
| Immigrants | Saudi Arabia | 62.9 /100 | #164 | Good $39,952 |
| Immigrants | Bangladesh | 60.8 /100 | #165 | Good $39,910 |
| Immigrants | Ghana | 60.0 /100 | #166 | Good $39,894 |
| Luxembourgers | 59.9 /100 | #167 | Average $39,891 |
| Immigrants | Peru | 58.9 /100 | #168 | Average $39,871 |