Immigrants from Mexico vs Cherokee Householder Income Under 25 years
COMPARE
Immigrants from Mexico
Cherokee
Householder Income Under 25 years
Householder Income Under 25 years Comparison
Immigrants from Mexico
Cherokee
$50,422
HOUSEHOLDER INCOME UNDER 25 YEARS
1.3/ 100
METRIC RATING
252nd/ 347
METRIC RANK
$47,848
HOUSEHOLDER INCOME UNDER 25 YEARS
0.0/ 100
METRIC RATING
305th/ 347
METRIC RANK
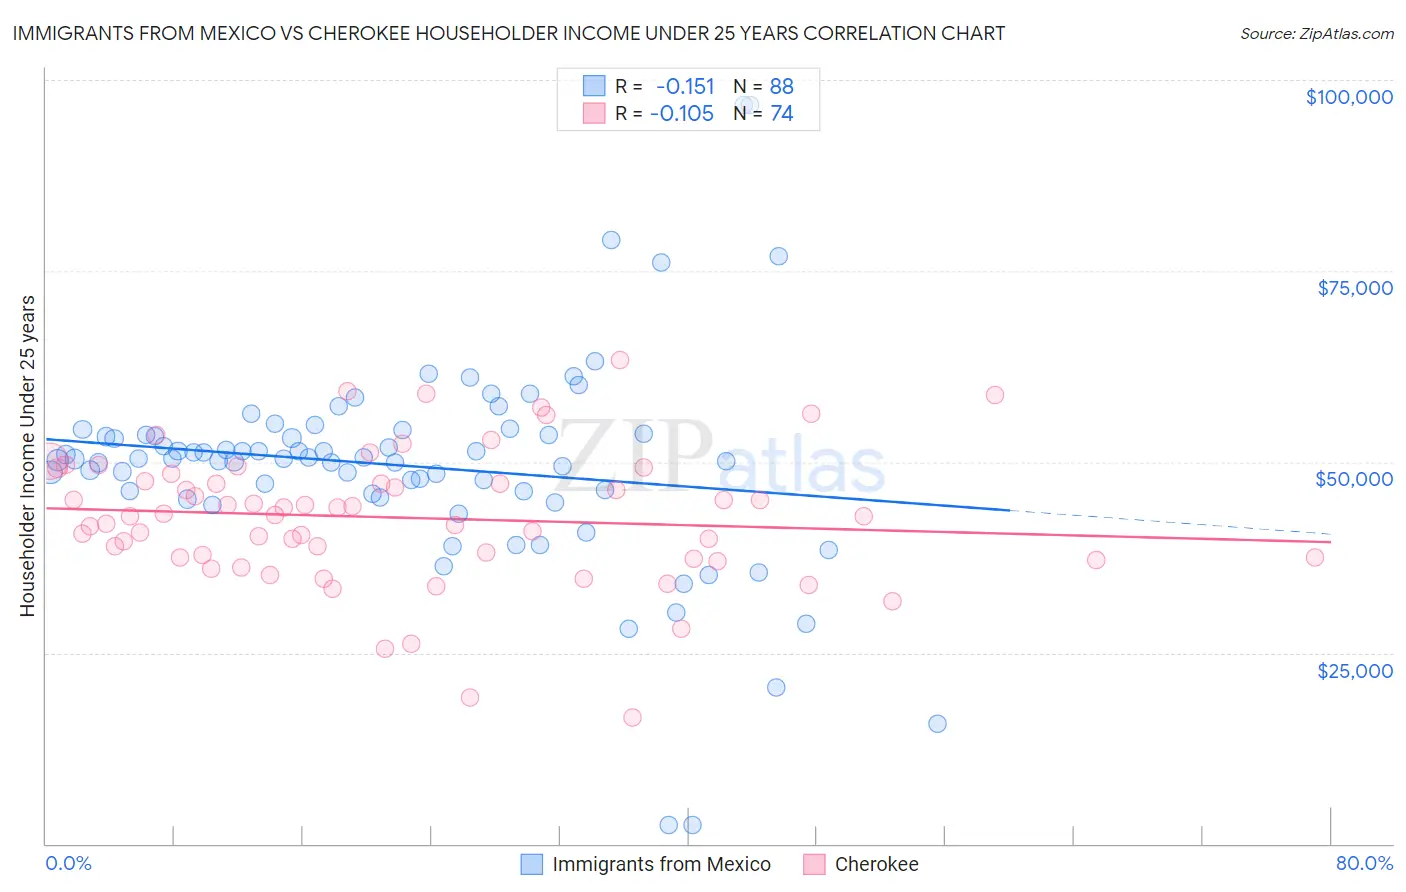
Immigrants from Mexico vs Cherokee Householder Income Under 25 years Correlation Chart
The statistical analysis conducted on geographies consisting of 414,348,765 people shows a poor negative correlation between the proportion of Immigrants from Mexico and household income with householder under the age of 25 in the United States with a correlation coefficient (R) of -0.151 and weighted average of $50,422. Similarly, the statistical analysis conducted on geographies consisting of 404,177,711 people shows a poor negative correlation between the proportion of Cherokee and household income with householder under the age of 25 in the United States with a correlation coefficient (R) of -0.105 and weighted average of $47,848, a difference of 5.4%.
Householder Income Under 25 years Correlation Summary
| Measurement | Immigrants from Mexico | Cherokee |
| Minimum | $2,499 | $16,563 |
| Maximum | $96,667 | $63,295 |
| Range | $94,168 | $46,732 |
| Mean | $49,454 | $42,680 |
| Median | $50,399 | $43,010 |
| Interquartile 25% (IQ1) | $45,992 | $37,476 |
| Interquartile 75% (IQ3) | $53,646 | $47,453 |
| Interquartile Range (IQR) | $7,654 | $9,977 |
| Standard Deviation (Sample) | $14,134 | $8,797 |
| Standard Deviation (Population) | $14,054 | $8,737 |
Similar Demographics by Householder Income Under 25 years
Demographics Similar to Immigrants from Mexico by Householder Income Under 25 years
In terms of householder income under 25 years, the demographic groups most similar to Immigrants from Mexico are Celtic ($50,447, a difference of 0.050%), Immigrants from Haiti ($50,398, a difference of 0.050%), Luxembourger ($50,379, a difference of 0.080%), Aleut ($50,377, a difference of 0.090%), and Immigrants from Cuba ($50,374, a difference of 0.090%).
| Demographics | Rating | Rank | Householder Income Under 25 years |
| Immigrants | Africa | 2.0 /100 | #245 | Tragic $50,609 |
| Welsh | 2.0 /100 | #246 | Tragic $50,597 |
| Immigrants | Bosnia and Herzegovina | 1.8 /100 | #247 | Tragic $50,565 |
| Slavs | 1.8 /100 | #248 | Tragic $50,563 |
| Scottish | 1.8 /100 | #249 | Tragic $50,554 |
| Immigrants | Cabo Verde | 1.7 /100 | #250 | Tragic $50,520 |
| Celtics | 1.4 /100 | #251 | Tragic $50,447 |
| Immigrants | Mexico | 1.3 /100 | #252 | Tragic $50,422 |
| Immigrants | Haiti | 1.2 /100 | #253 | Tragic $50,398 |
| Luxembourgers | 1.2 /100 | #254 | Tragic $50,379 |
| Aleuts | 1.2 /100 | #255 | Tragic $50,377 |
| Immigrants | Cuba | 1.2 /100 | #256 | Tragic $50,374 |
| Lebanese | 1.1 /100 | #257 | Tragic $50,355 |
| Whites/Caucasians | 1.1 /100 | #258 | Tragic $50,336 |
| Immigrants | Dominica | 1.0 /100 | #259 | Tragic $50,301 |
Demographics Similar to Cherokee by Householder Income Under 25 years
In terms of householder income under 25 years, the demographic groups most similar to Cherokee are Menominee ($47,907, a difference of 0.12%), Immigrants from Middle Africa ($47,916, a difference of 0.14%), Immigrants from Liberia ($47,981, a difference of 0.28%), Native/Alaskan ($47,704, a difference of 0.30%), and Bangladeshi ($47,589, a difference of 0.55%).
| Demographics | Rating | Rank | Householder Income Under 25 years |
| Yaqui | 0.0 /100 | #298 | Tragic $48,300 |
| Immigrants | Honduras | 0.0 /100 | #299 | Tragic $48,267 |
| Immigrants | Somalia | 0.0 /100 | #300 | Tragic $48,135 |
| Immigrants | Kuwait | 0.0 /100 | #301 | Tragic $48,126 |
| Immigrants | Liberia | 0.0 /100 | #302 | Tragic $47,981 |
| Immigrants | Middle Africa | 0.0 /100 | #303 | Tragic $47,916 |
| Menominee | 0.0 /100 | #304 | Tragic $47,907 |
| Cherokee | 0.0 /100 | #305 | Tragic $47,848 |
| Natives/Alaskans | 0.0 /100 | #306 | Tragic $47,704 |
| Bangladeshis | 0.0 /100 | #307 | Tragic $47,589 |
| Comanche | 0.0 /100 | #308 | Tragic $47,518 |
| U.S. Virgin Islanders | 0.0 /100 | #309 | Tragic $47,448 |
| Iroquois | 0.0 /100 | #310 | Tragic $47,380 |
| Ottawa | 0.0 /100 | #311 | Tragic $47,366 |
| Bermudans | 0.0 /100 | #312 | Tragic $47,359 |