Guyanese vs Cherokee Householder Income Under 25 years
COMPARE
Guyanese
Cherokee
Householder Income Under 25 years
Householder Income Under 25 years Comparison
Guyanese
Cherokee
$55,210
HOUSEHOLDER INCOME UNDER 25 YEARS
99.9/ 100
METRIC RATING
58th/ 347
METRIC RANK
$47,848
HOUSEHOLDER INCOME UNDER 25 YEARS
0.0/ 100
METRIC RATING
305th/ 347
METRIC RANK
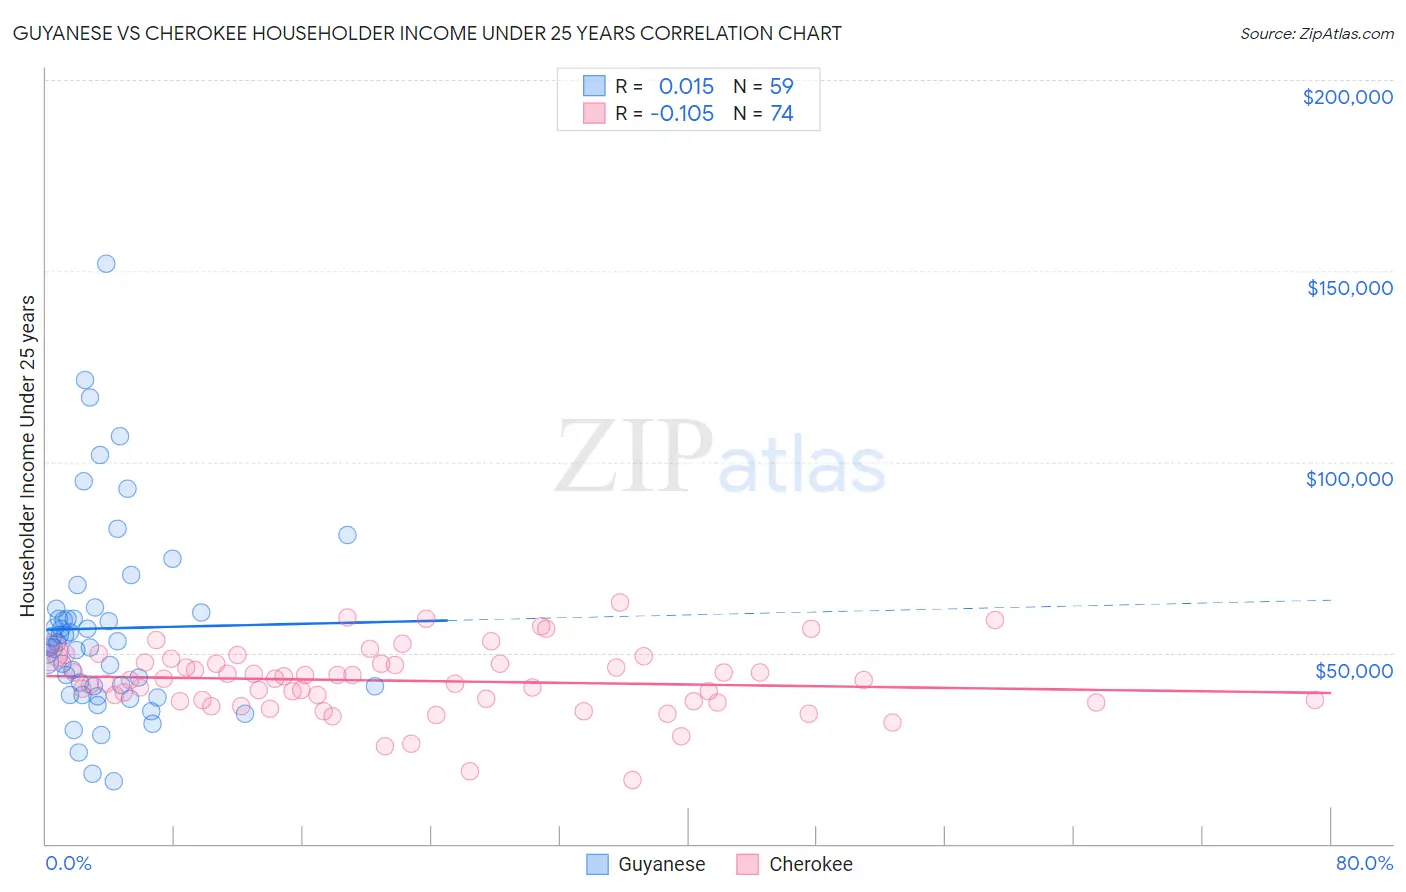
Guyanese vs Cherokee Householder Income Under 25 years Correlation Chart
The statistical analysis conducted on geographies consisting of 154,823,107 people shows no correlation between the proportion of Guyanese and household income with householder under the age of 25 in the United States with a correlation coefficient (R) of 0.015 and weighted average of $55,210. Similarly, the statistical analysis conducted on geographies consisting of 404,177,711 people shows a poor negative correlation between the proportion of Cherokee and household income with householder under the age of 25 in the United States with a correlation coefficient (R) of -0.105 and weighted average of $47,848, a difference of 15.4%.
Householder Income Under 25 years Correlation Summary
| Measurement | Guyanese | Cherokee |
| Minimum | $16,250 | $16,563 |
| Maximum | $151,864 | $63,295 |
| Range | $135,614 | $46,732 |
| Mean | $56,409 | $42,680 |
| Median | $51,977 | $43,010 |
| Interquartile 25% (IQ1) | $41,119 | $37,476 |
| Interquartile 75% (IQ3) | $60,617 | $47,453 |
| Interquartile Range (IQR) | $19,498 | $9,977 |
| Standard Deviation (Sample) | $25,406 | $8,797 |
| Standard Deviation (Population) | $25,190 | $8,737 |
Similar Demographics by Householder Income Under 25 years
Demographics Similar to Guyanese by Householder Income Under 25 years
In terms of householder income under 25 years, the demographic groups most similar to Guyanese are Native Hawaiian ($55,158, a difference of 0.090%), Soviet Union ($55,340, a difference of 0.24%), Immigrants from Lithuania ($55,028, a difference of 0.33%), Immigrants from Europe ($55,022, a difference of 0.34%), and Salvadoran ($55,412, a difference of 0.37%).
| Demographics | Rating | Rank | Householder Income Under 25 years |
| Immigrants | Romania | 100.0 /100 | #51 | Exceptional $55,522 |
| Immigrants | Indonesia | 100.0 /100 | #52 | Exceptional $55,521 |
| Immigrants | Poland | 100.0 /100 | #53 | Exceptional $55,474 |
| Sri Lankans | 100.0 /100 | #54 | Exceptional $55,470 |
| Immigrants | Ukraine | 100.0 /100 | #55 | Exceptional $55,447 |
| Salvadorans | 100.0 /100 | #56 | Exceptional $55,412 |
| Soviet Union | 100.0 /100 | #57 | Exceptional $55,340 |
| Guyanese | 99.9 /100 | #58 | Exceptional $55,210 |
| Native Hawaiians | 99.9 /100 | #59 | Exceptional $55,158 |
| Immigrants | Lithuania | 99.9 /100 | #60 | Exceptional $55,028 |
| Immigrants | Europe | 99.9 /100 | #61 | Exceptional $55,022 |
| Immigrants | Uzbekistan | 99.8 /100 | #62 | Exceptional $54,846 |
| Immigrants | Belgium | 99.8 /100 | #63 | Exceptional $54,830 |
| Burmese | 99.8 /100 | #64 | Exceptional $54,800 |
| Yup'ik | 99.8 /100 | #65 | Exceptional $54,732 |
Demographics Similar to Cherokee by Householder Income Under 25 years
In terms of householder income under 25 years, the demographic groups most similar to Cherokee are Menominee ($47,907, a difference of 0.12%), Immigrants from Middle Africa ($47,916, a difference of 0.14%), Immigrants from Liberia ($47,981, a difference of 0.28%), Native/Alaskan ($47,704, a difference of 0.30%), and Bangladeshi ($47,589, a difference of 0.55%).
| Demographics | Rating | Rank | Householder Income Under 25 years |
| Yaqui | 0.0 /100 | #298 | Tragic $48,300 |
| Immigrants | Honduras | 0.0 /100 | #299 | Tragic $48,267 |
| Immigrants | Somalia | 0.0 /100 | #300 | Tragic $48,135 |
| Immigrants | Kuwait | 0.0 /100 | #301 | Tragic $48,126 |
| Immigrants | Liberia | 0.0 /100 | #302 | Tragic $47,981 |
| Immigrants | Middle Africa | 0.0 /100 | #303 | Tragic $47,916 |
| Menominee | 0.0 /100 | #304 | Tragic $47,907 |
| Cherokee | 0.0 /100 | #305 | Tragic $47,848 |
| Natives/Alaskans | 0.0 /100 | #306 | Tragic $47,704 |
| Bangladeshis | 0.0 /100 | #307 | Tragic $47,589 |
| Comanche | 0.0 /100 | #308 | Tragic $47,518 |
| U.S. Virgin Islanders | 0.0 /100 | #309 | Tragic $47,448 |
| Iroquois | 0.0 /100 | #310 | Tragic $47,380 |
| Ottawa | 0.0 /100 | #311 | Tragic $47,366 |
| Bermudans | 0.0 /100 | #312 | Tragic $47,359 |