Immigrants from Mexico vs German Russian Householder Income Under 25 years
COMPARE
Immigrants from Mexico
German Russian
Householder Income Under 25 years
Householder Income Under 25 years Comparison
Immigrants from Mexico
German Russians
$50,422
HOUSEHOLDER INCOME UNDER 25 YEARS
1.3/ 100
METRIC RATING
252nd/ 347
METRIC RANK
$45,673
HOUSEHOLDER INCOME UNDER 25 YEARS
0.0/ 100
METRIC RATING
328th/ 347
METRIC RANK
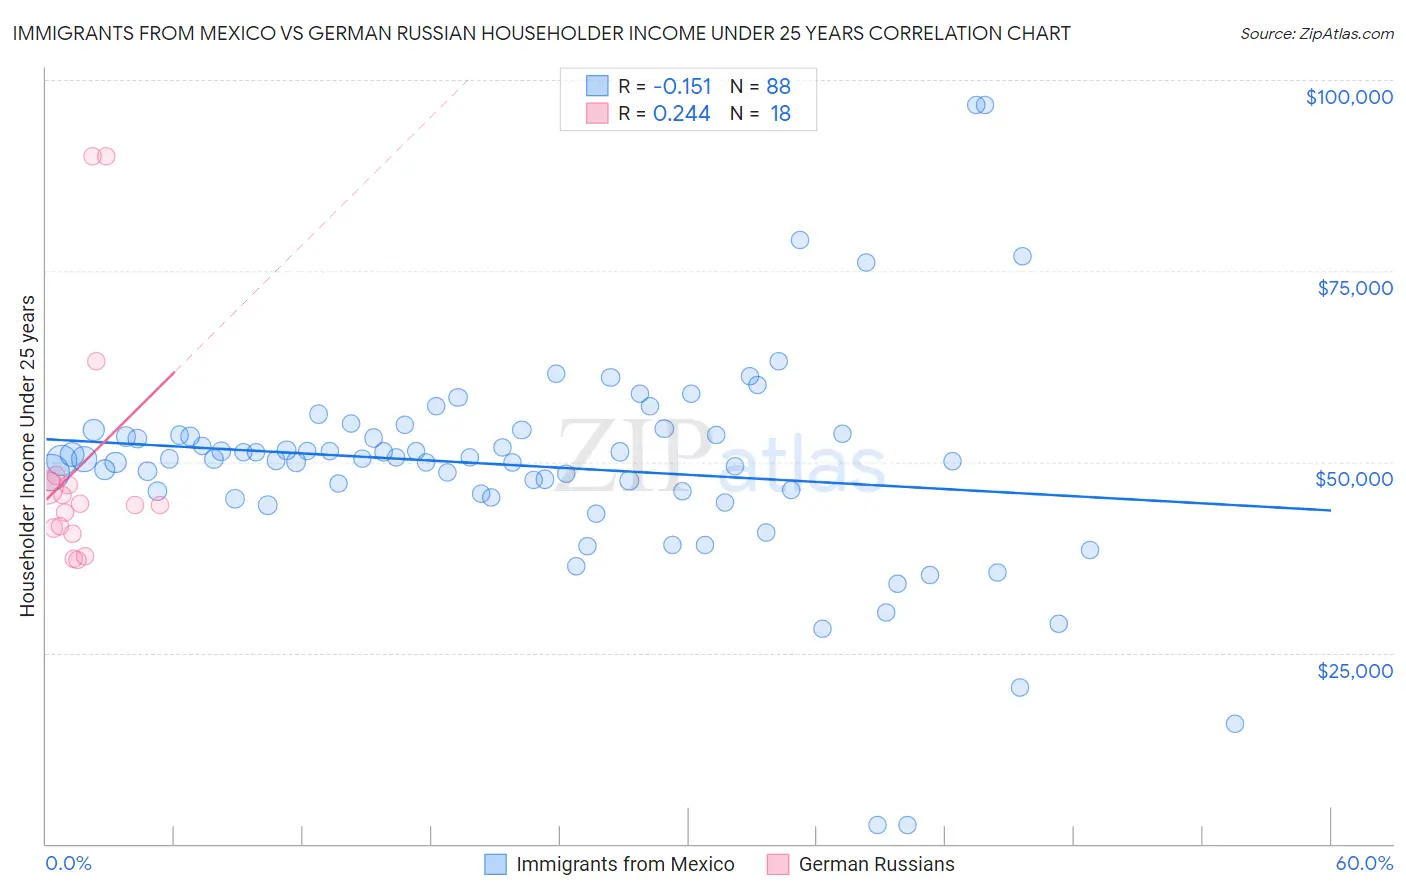
Immigrants from Mexico vs German Russian Householder Income Under 25 years Correlation Chart
The statistical analysis conducted on geographies consisting of 414,348,765 people shows a poor negative correlation between the proportion of Immigrants from Mexico and household income with householder under the age of 25 in the United States with a correlation coefficient (R) of -0.151 and weighted average of $50,422. Similarly, the statistical analysis conducted on geographies consisting of 91,630,953 people shows a weak positive correlation between the proportion of German Russians and household income with householder under the age of 25 in the United States with a correlation coefficient (R) of 0.244 and weighted average of $45,673, a difference of 10.4%.
Householder Income Under 25 years Correlation Summary
| Measurement | Immigrants from Mexico | German Russian |
| Minimum | $2,499 | $37,121 |
| Maximum | $96,667 | $90,000 |
| Range | $94,168 | $52,879 |
| Mean | $49,454 | $49,457 |
| Median | $50,399 | $44,409 |
| Interquartile 25% (IQ1) | $45,992 | $41,330 |
| Interquartile 75% (IQ3) | $53,646 | $47,417 |
| Interquartile Range (IQR) | $7,654 | $6,088 |
| Standard Deviation (Sample) | $14,134 | $15,850 |
| Standard Deviation (Population) | $14,054 | $15,403 |
Similar Demographics by Householder Income Under 25 years
Demographics Similar to Immigrants from Mexico by Householder Income Under 25 years
In terms of householder income under 25 years, the demographic groups most similar to Immigrants from Mexico are Celtic ($50,447, a difference of 0.050%), Immigrants from Haiti ($50,398, a difference of 0.050%), Luxembourger ($50,379, a difference of 0.080%), Aleut ($50,377, a difference of 0.090%), and Immigrants from Cuba ($50,374, a difference of 0.090%).
| Demographics | Rating | Rank | Householder Income Under 25 years |
| Immigrants | Africa | 2.0 /100 | #245 | Tragic $50,609 |
| Welsh | 2.0 /100 | #246 | Tragic $50,597 |
| Immigrants | Bosnia and Herzegovina | 1.8 /100 | #247 | Tragic $50,565 |
| Slavs | 1.8 /100 | #248 | Tragic $50,563 |
| Scottish | 1.8 /100 | #249 | Tragic $50,554 |
| Immigrants | Cabo Verde | 1.7 /100 | #250 | Tragic $50,520 |
| Celtics | 1.4 /100 | #251 | Tragic $50,447 |
| Immigrants | Mexico | 1.3 /100 | #252 | Tragic $50,422 |
| Immigrants | Haiti | 1.2 /100 | #253 | Tragic $50,398 |
| Luxembourgers | 1.2 /100 | #254 | Tragic $50,379 |
| Aleuts | 1.2 /100 | #255 | Tragic $50,377 |
| Immigrants | Cuba | 1.2 /100 | #256 | Tragic $50,374 |
| Lebanese | 1.1 /100 | #257 | Tragic $50,355 |
| Whites/Caucasians | 1.1 /100 | #258 | Tragic $50,336 |
| Immigrants | Dominica | 1.0 /100 | #259 | Tragic $50,301 |
Demographics Similar to German Russians by Householder Income Under 25 years
In terms of householder income under 25 years, the demographic groups most similar to German Russians are Seminole ($45,649, a difference of 0.050%), Bahamian ($45,743, a difference of 0.15%), Osage ($45,764, a difference of 0.20%), Indonesian ($45,566, a difference of 0.23%), and Immigrants from Bahamas ($45,793, a difference of 0.26%).
| Demographics | Rating | Rank | Householder Income Under 25 years |
| Potawatomi | 0.0 /100 | #321 | Tragic $46,462 |
| Sioux | 0.0 /100 | #322 | Tragic $46,417 |
| Immigrants | Saudi Arabia | 0.0 /100 | #323 | Tragic $46,187 |
| Dutch West Indians | 0.0 /100 | #324 | Tragic $45,816 |
| Immigrants | Bahamas | 0.0 /100 | #325 | Tragic $45,793 |
| Osage | 0.0 /100 | #326 | Tragic $45,764 |
| Bahamians | 0.0 /100 | #327 | Tragic $45,743 |
| German Russians | 0.0 /100 | #328 | Tragic $45,673 |
| Seminole | 0.0 /100 | #329 | Tragic $45,649 |
| Indonesians | 0.0 /100 | #330 | Tragic $45,566 |
| Immigrants | Zaire | 0.0 /100 | #331 | Tragic $45,529 |
| Choctaw | 0.0 /100 | #332 | Tragic $45,450 |
| Creek | 0.0 /100 | #333 | Tragic $45,371 |
| Cajuns | 0.0 /100 | #334 | Tragic $45,338 |
| Cheyenne | 0.0 /100 | #335 | Tragic $45,275 |