Estonian vs Cherokee Householder Income Under 25 years
COMPARE
Estonian
Cherokee
Householder Income Under 25 years
Householder Income Under 25 years Comparison
Estonians
Cherokee
$51,523
HOUSEHOLDER INCOME UNDER 25 YEARS
16.4/ 100
METRIC RATING
195th/ 347
METRIC RANK
$47,848
HOUSEHOLDER INCOME UNDER 25 YEARS
0.0/ 100
METRIC RATING
305th/ 347
METRIC RANK
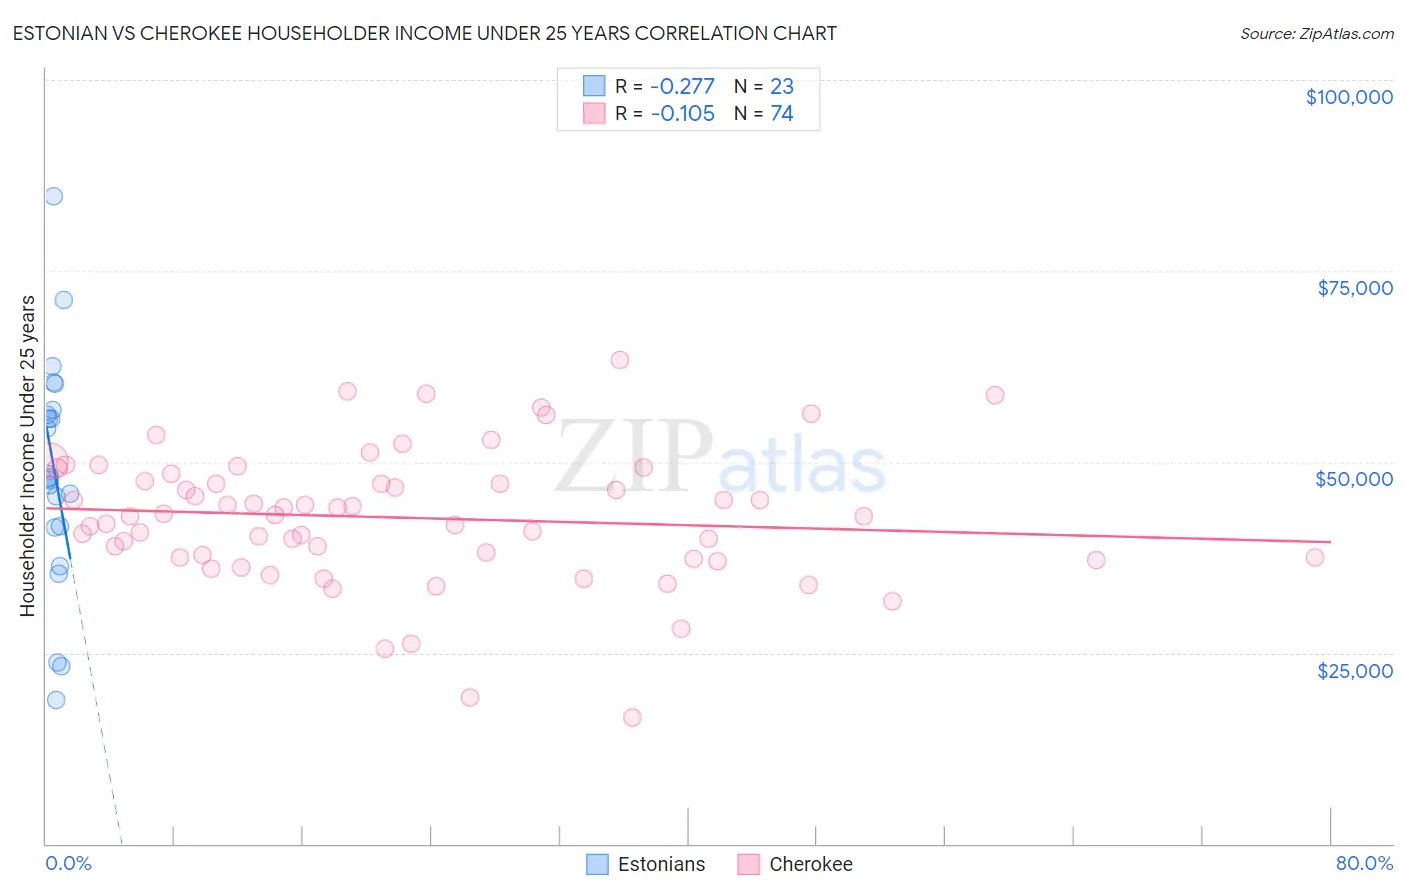
Estonian vs Cherokee Householder Income Under 25 years Correlation Chart
The statistical analysis conducted on geographies consisting of 111,851,502 people shows a weak negative correlation between the proportion of Estonians and household income with householder under the age of 25 in the United States with a correlation coefficient (R) of -0.277 and weighted average of $51,523. Similarly, the statistical analysis conducted on geographies consisting of 404,177,711 people shows a poor negative correlation between the proportion of Cherokee and household income with householder under the age of 25 in the United States with a correlation coefficient (R) of -0.105 and weighted average of $47,848, a difference of 7.7%.
Householder Income Under 25 years Correlation Summary
| Measurement | Estonian | Cherokee |
| Minimum | $18,790 | $16,563 |
| Maximum | $84,706 | $63,295 |
| Range | $65,916 | $46,732 |
| Mean | $48,704 | $42,680 |
| Median | $47,907 | $43,010 |
| Interquartile 25% (IQ1) | $41,381 | $37,476 |
| Interquartile 75% (IQ3) | $56,834 | $47,453 |
| Interquartile Range (IQR) | $15,453 | $9,977 |
| Standard Deviation (Sample) | $15,301 | $8,797 |
| Standard Deviation (Population) | $14,964 | $8,737 |
Similar Demographics by Householder Income Under 25 years
Demographics Similar to Estonians by Householder Income Under 25 years
In terms of householder income under 25 years, the demographic groups most similar to Estonians are Guatemalan ($51,525, a difference of 0.0%), Palestinian ($51,515, a difference of 0.020%), Pima ($51,503, a difference of 0.040%), Immigrants from Syria ($51,494, a difference of 0.060%), and Swiss ($51,493, a difference of 0.060%).
| Demographics | Rating | Rank | Householder Income Under 25 years |
| Northern Europeans | 22.2 /100 | #188 | Fair $51,678 |
| Croatians | 21.6 /100 | #189 | Fair $51,662 |
| Malaysians | 19.7 /100 | #190 | Poor $51,615 |
| Panamanians | 19.5 /100 | #191 | Poor $51,611 |
| West Indians | 18.5 /100 | #192 | Poor $51,583 |
| Immigrants | Eritrea | 18.1 /100 | #193 | Poor $51,574 |
| Guatemalans | 16.4 /100 | #194 | Poor $51,525 |
| Estonians | 16.4 /100 | #195 | Poor $51,523 |
| Palestinians | 16.1 /100 | #196 | Poor $51,515 |
| Pima | 15.7 /100 | #197 | Poor $51,503 |
| Immigrants | Syria | 15.4 /100 | #198 | Poor $51,494 |
| Swiss | 15.4 /100 | #199 | Poor $51,493 |
| Immigrants | West Indies | 14.9 /100 | #200 | Poor $51,479 |
| British | 14.9 /100 | #201 | Poor $51,477 |
| Immigrants | Guatemala | 14.0 /100 | #202 | Poor $51,447 |
Demographics Similar to Cherokee by Householder Income Under 25 years
In terms of householder income under 25 years, the demographic groups most similar to Cherokee are Menominee ($47,907, a difference of 0.12%), Immigrants from Middle Africa ($47,916, a difference of 0.14%), Immigrants from Liberia ($47,981, a difference of 0.28%), Native/Alaskan ($47,704, a difference of 0.30%), and Bangladeshi ($47,589, a difference of 0.55%).
| Demographics | Rating | Rank | Householder Income Under 25 years |
| Yaqui | 0.0 /100 | #298 | Tragic $48,300 |
| Immigrants | Honduras | 0.0 /100 | #299 | Tragic $48,267 |
| Immigrants | Somalia | 0.0 /100 | #300 | Tragic $48,135 |
| Immigrants | Kuwait | 0.0 /100 | #301 | Tragic $48,126 |
| Immigrants | Liberia | 0.0 /100 | #302 | Tragic $47,981 |
| Immigrants | Middle Africa | 0.0 /100 | #303 | Tragic $47,916 |
| Menominee | 0.0 /100 | #304 | Tragic $47,907 |
| Cherokee | 0.0 /100 | #305 | Tragic $47,848 |
| Natives/Alaskans | 0.0 /100 | #306 | Tragic $47,704 |
| Bangladeshis | 0.0 /100 | #307 | Tragic $47,589 |
| Comanche | 0.0 /100 | #308 | Tragic $47,518 |
| U.S. Virgin Islanders | 0.0 /100 | #309 | Tragic $47,448 |
| Iroquois | 0.0 /100 | #310 | Tragic $47,380 |
| Ottawa | 0.0 /100 | #311 | Tragic $47,366 |
| Bermudans | 0.0 /100 | #312 | Tragic $47,359 |