Shoshone vs Cherokee Householder Income Under 25 years
COMPARE
Shoshone
Cherokee
Householder Income Under 25 years
Householder Income Under 25 years Comparison
Shoshone
Cherokee
$48,720
HOUSEHOLDER INCOME UNDER 25 YEARS
0.0/ 100
METRIC RATING
292nd/ 347
METRIC RANK
$47,848
HOUSEHOLDER INCOME UNDER 25 YEARS
0.0/ 100
METRIC RATING
305th/ 347
METRIC RANK
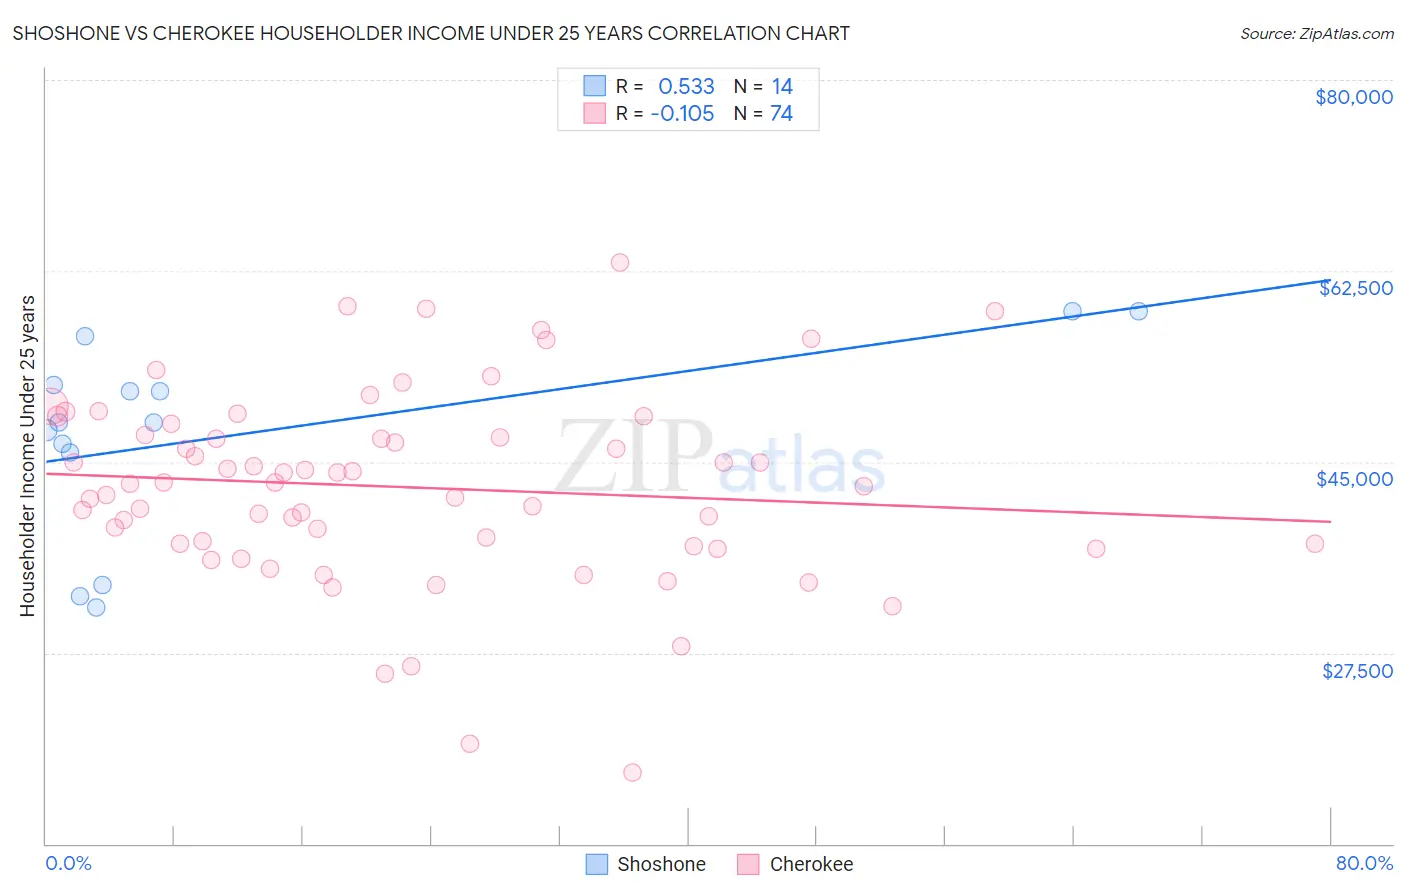
Shoshone vs Cherokee Householder Income Under 25 years Correlation Chart
The statistical analysis conducted on geographies consisting of 63,873,946 people shows a substantial positive correlation between the proportion of Shoshone and household income with householder under the age of 25 in the United States with a correlation coefficient (R) of 0.533 and weighted average of $48,720. Similarly, the statistical analysis conducted on geographies consisting of 404,177,711 people shows a poor negative correlation between the proportion of Cherokee and household income with householder under the age of 25 in the United States with a correlation coefficient (R) of -0.105 and weighted average of $47,848, a difference of 1.8%.
Householder Income Under 25 years Correlation Summary
| Measurement | Shoshone | Cherokee |
| Minimum | $31,607 | $16,563 |
| Maximum | $58,750 | $63,295 |
| Range | $27,143 | $46,732 |
| Mean | $47,477 | $42,680 |
| Median | $48,627 | $43,010 |
| Interquartile 25% (IQ1) | $45,864 | $37,476 |
| Interquartile 75% (IQ3) | $52,070 | $47,453 |
| Interquartile Range (IQR) | $6,206 | $9,977 |
| Standard Deviation (Sample) | $9,004 | $8,797 |
| Standard Deviation (Population) | $8,676 | $8,737 |
Demographics Similar to Shoshone and Cherokee by Householder Income Under 25 years
In terms of householder income under 25 years, the demographic groups most similar to Shoshone are Immigrants from Burma/Myanmar ($48,749, a difference of 0.060%), Subsaharan African ($48,691, a difference of 0.060%), Somali ($48,657, a difference of 0.13%), Central American Indian ($48,643, a difference of 0.16%), and Blackfeet ($48,603, a difference of 0.24%). Similarly, the demographic groups most similar to Cherokee are Menominee ($47,907, a difference of 0.12%), Immigrants from Middle Africa ($47,916, a difference of 0.14%), Immigrants from Liberia ($47,981, a difference of 0.28%), Native/Alaskan ($47,704, a difference of 0.30%), and Bangladeshi ($47,589, a difference of 0.55%).
| Demographics | Rating | Rank | Householder Income Under 25 years |
| Liberians | 0.0 /100 | #288 | Tragic $48,917 |
| Hondurans | 0.0 /100 | #289 | Tragic $48,885 |
| Americans | 0.0 /100 | #290 | Tragic $48,860 |
| Immigrants | Burma/Myanmar | 0.0 /100 | #291 | Tragic $48,749 |
| Shoshone | 0.0 /100 | #292 | Tragic $48,720 |
| Sub-Saharan Africans | 0.0 /100 | #293 | Tragic $48,691 |
| Somalis | 0.0 /100 | #294 | Tragic $48,657 |
| Central American Indians | 0.0 /100 | #295 | Tragic $48,643 |
| Blackfeet | 0.0 /100 | #296 | Tragic $48,603 |
| Cree | 0.0 /100 | #297 | Tragic $48,514 |
| Yaqui | 0.0 /100 | #298 | Tragic $48,300 |
| Immigrants | Honduras | 0.0 /100 | #299 | Tragic $48,267 |
| Immigrants | Somalia | 0.0 /100 | #300 | Tragic $48,135 |
| Immigrants | Kuwait | 0.0 /100 | #301 | Tragic $48,126 |
| Immigrants | Liberia | 0.0 /100 | #302 | Tragic $47,981 |
| Immigrants | Middle Africa | 0.0 /100 | #303 | Tragic $47,916 |
| Menominee | 0.0 /100 | #304 | Tragic $47,907 |
| Cherokee | 0.0 /100 | #305 | Tragic $47,848 |
| Natives/Alaskans | 0.0 /100 | #306 | Tragic $47,704 |
| Bangladeshis | 0.0 /100 | #307 | Tragic $47,589 |
| Comanche | 0.0 /100 | #308 | Tragic $47,518 |