Immigrants from Lithuania vs Immigrants from Bolivia Cognitive Disability
COMPARE
Immigrants from Lithuania
Immigrants from Bolivia
Cognitive Disability
Cognitive Disability Comparison
Immigrants from Lithuania
Immigrants from Bolivia
16.0%
COGNITIVE DISABILITY
100.0/ 100
METRIC RATING
4th/ 347
METRIC RANK
16.3%
COGNITIVE DISABILITY
100.0/ 100
METRIC RATING
19th/ 347
METRIC RANK
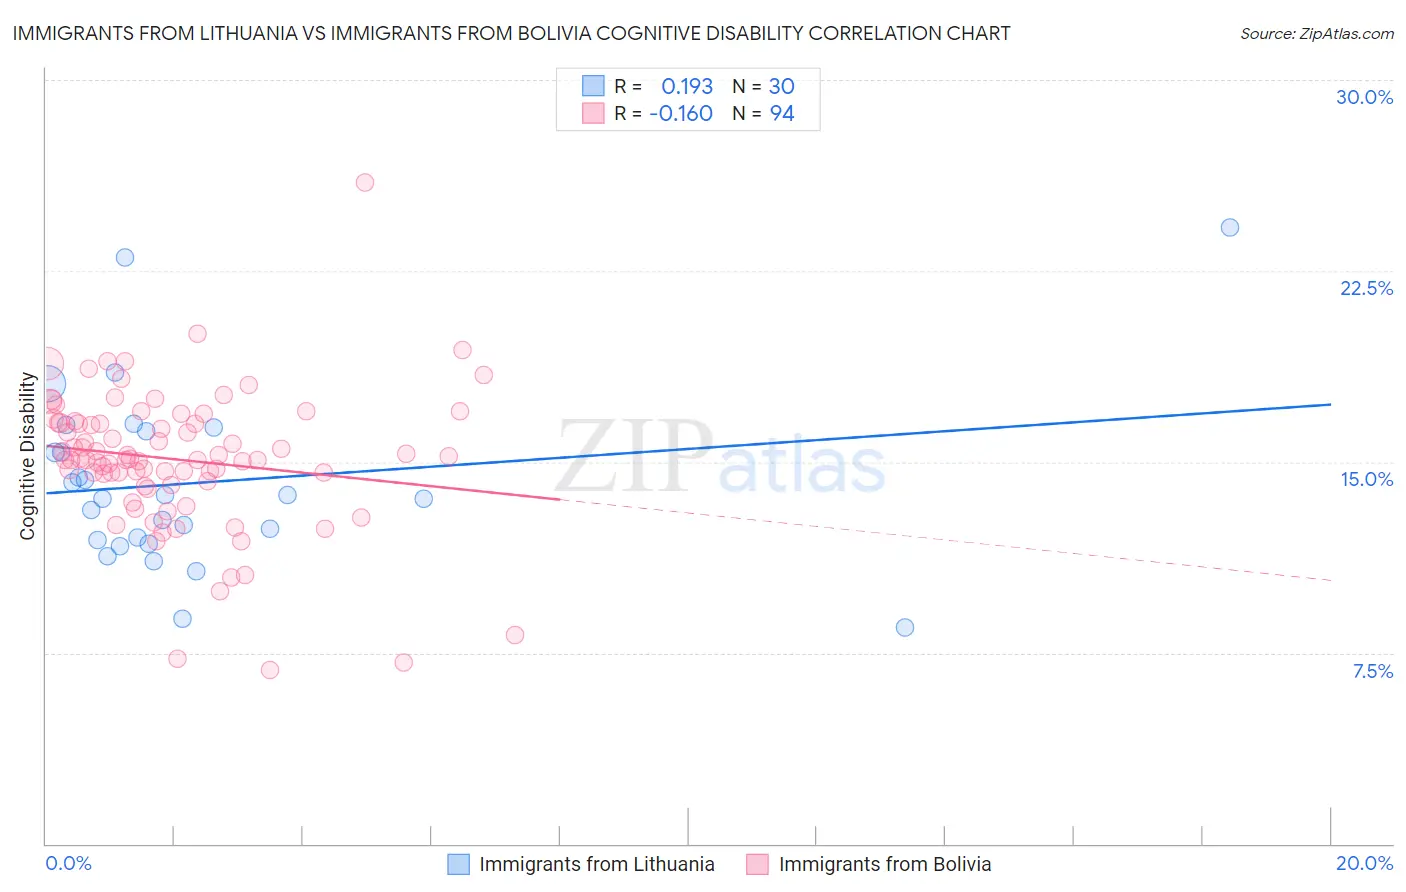
Immigrants from Lithuania vs Immigrants from Bolivia Cognitive Disability Correlation Chart
The statistical analysis conducted on geographies consisting of 117,722,792 people shows a poor positive correlation between the proportion of Immigrants from Lithuania and percentage of population with cognitive disability in the United States with a correlation coefficient (R) of 0.193 and weighted average of 16.0%. Similarly, the statistical analysis conducted on geographies consisting of 158,730,419 people shows a poor negative correlation between the proportion of Immigrants from Bolivia and percentage of population with cognitive disability in the United States with a correlation coefficient (R) of -0.160 and weighted average of 16.3%, a difference of 2.4%.
Cognitive Disability Correlation Summary
| Measurement | Immigrants from Lithuania | Immigrants from Bolivia |
| Minimum | 8.5% | 6.8% |
| Maximum | 24.2% | 26.0% |
| Range | 15.7% | 19.2% |
| Mean | 14.2% | 15.1% |
| Median | 13.6% | 15.1% |
| Interquartile 25% (IQ1) | 11.9% | 14.2% |
| Interquartile 75% (IQ3) | 16.2% | 16.5% |
| Interquartile Range (IQR) | 4.3% | 2.3% |
| Standard Deviation (Sample) | 3.5% | 2.8% |
| Standard Deviation (Population) | 3.5% | 2.8% |
Demographics Similar to Immigrants from Lithuania and Immigrants from Bolivia by Cognitive Disability
In terms of cognitive disability, the demographic groups most similar to Immigrants from Lithuania are Chinese (15.9%, a difference of 0.18%), Immigrants from India (15.9%, a difference of 0.27%), Immigrants from Hong Kong (16.0%, a difference of 0.41%), Thai (16.1%, a difference of 1.0%), and Immigrants from Ireland (16.1%, a difference of 1.1%). Similarly, the demographic groups most similar to Immigrants from Bolivia are Immigrants from Northern Europe (16.3%, a difference of 0.0%), Bulgarian (16.3%, a difference of 0.010%), Immigrants from Cuba (16.3%, a difference of 0.060%), Immigrants from North Macedonia (16.3%, a difference of 0.070%), and Eastern European (16.3%, a difference of 0.090%).
| Demographics | Rating | Rank | Cognitive Disability |
| Immigrants | Taiwan | 100.0 /100 | #1 | Exceptional 15.7% |
| Immigrants | India | 100.0 /100 | #2 | Exceptional 15.9% |
| Chinese | 100.0 /100 | #3 | Exceptional 15.9% |
| Immigrants | Lithuania | 100.0 /100 | #4 | Exceptional 16.0% |
| Immigrants | Hong Kong | 100.0 /100 | #5 | Exceptional 16.0% |
| Thais | 100.0 /100 | #6 | Exceptional 16.1% |
| Immigrants | Ireland | 100.0 /100 | #7 | Exceptional 16.1% |
| Immigrants | Poland | 100.0 /100 | #8 | Exceptional 16.1% |
| Assyrians/Chaldeans/Syriacs | 100.0 /100 | #9 | Exceptional 16.2% |
| Immigrants | Scotland | 100.0 /100 | #10 | Exceptional 16.2% |
| Immigrants | Czechoslovakia | 100.0 /100 | #11 | Exceptional 16.2% |
| Maltese | 100.0 /100 | #12 | Exceptional 16.2% |
| Lithuanians | 100.0 /100 | #13 | Exceptional 16.3% |
| Immigrants | Austria | 100.0 /100 | #14 | Exceptional 16.3% |
| Immigrants | Greece | 100.0 /100 | #15 | Exceptional 16.3% |
| Eastern Europeans | 100.0 /100 | #16 | Exceptional 16.3% |
| Immigrants | North Macedonia | 100.0 /100 | #17 | Exceptional 16.3% |
| Immigrants | Northern Europe | 100.0 /100 | #18 | Exceptional 16.3% |
| Immigrants | Bolivia | 100.0 /100 | #19 | Exceptional 16.3% |
| Bulgarians | 100.0 /100 | #20 | Exceptional 16.3% |
| Immigrants | Cuba | 100.0 /100 | #21 | Exceptional 16.3% |