Immigrants from Liberia vs Hopi Median Family Income
COMPARE
Immigrants from Liberia
Hopi
Median Family Income
Median Family Income Comparison
Immigrants from Liberia
Hopi
$90,450
MEDIAN FAMILY INCOME
0.2/ 100
METRIC RATING
272nd/ 347
METRIC RANK
$77,188
MEDIAN FAMILY INCOME
0.0/ 100
METRIC RATING
340th/ 347
METRIC RANK
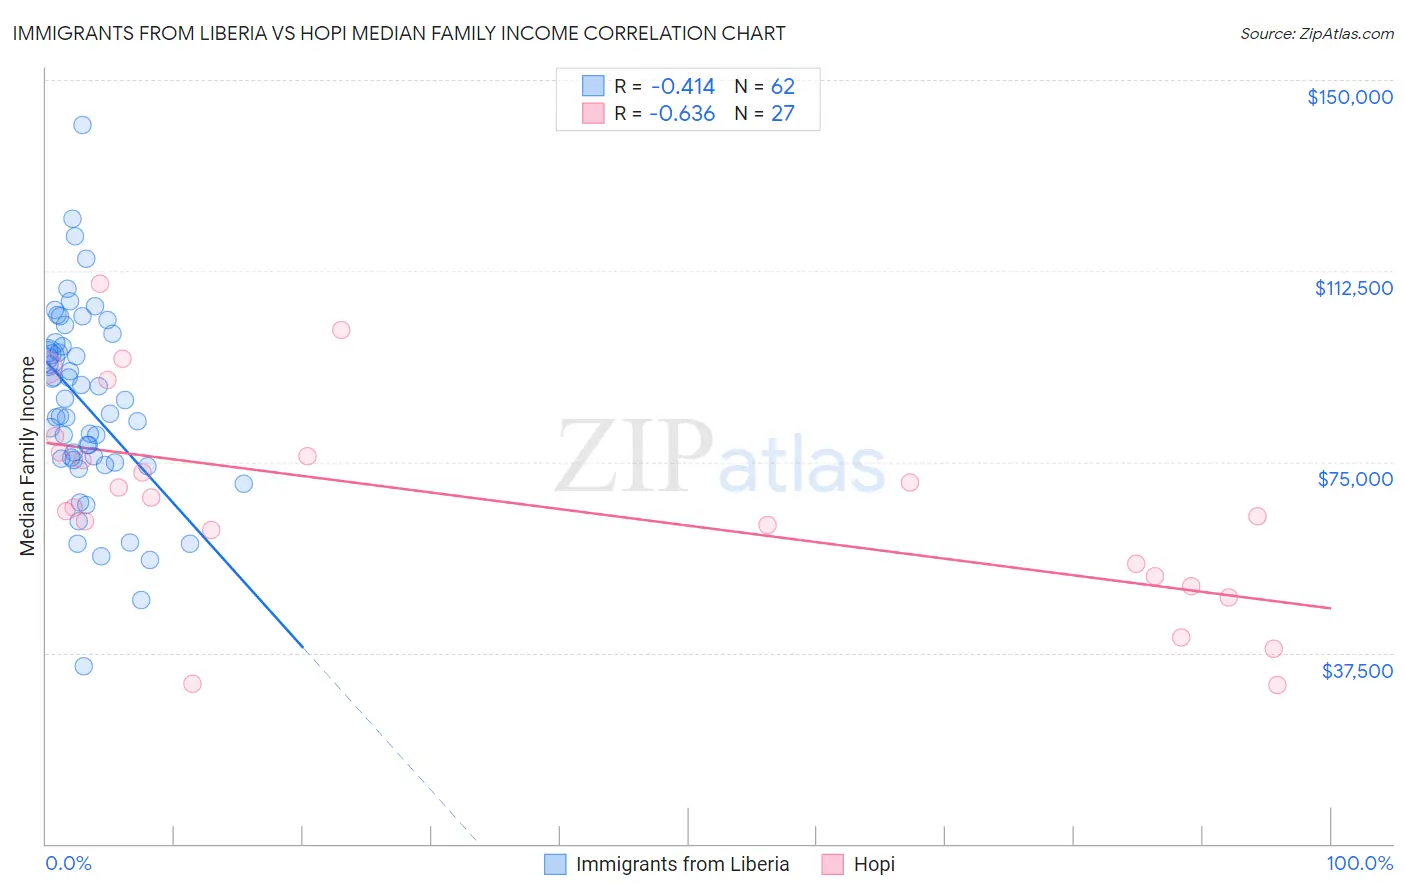
Immigrants from Liberia vs Hopi Median Family Income Correlation Chart
The statistical analysis conducted on geographies consisting of 135,228,267 people shows a moderate negative correlation between the proportion of Immigrants from Liberia and median family income in the United States with a correlation coefficient (R) of -0.414 and weighted average of $90,450. Similarly, the statistical analysis conducted on geographies consisting of 74,729,125 people shows a significant negative correlation between the proportion of Hopi and median family income in the United States with a correlation coefficient (R) of -0.636 and weighted average of $77,188, a difference of 17.2%.
Median Family Income Correlation Summary
| Measurement | Immigrants from Liberia | Hopi |
| Minimum | $34,978 | $31,250 |
| Maximum | $141,080 | $109,922 |
| Range | $106,102 | $78,672 |
| Mean | $86,151 | $67,112 |
| Median | $85,817 | $66,093 |
| Interquartile 25% (IQ1) | $75,284 | $52,500 |
| Interquartile 75% (IQ3) | $97,769 | $76,955 |
| Interquartile Range (IQR) | $22,485 | $24,455 |
| Standard Deviation (Sample) | $18,837 | $20,243 |
| Standard Deviation (Population) | $18,685 | $19,865 |
Similar Demographics by Median Family Income
Demographics Similar to Immigrants from Liberia by Median Family Income
In terms of median family income, the demographic groups most similar to Immigrants from Liberia are Iroquois ($90,543, a difference of 0.10%), Immigrants from Micronesia ($90,345, a difference of 0.12%), Jamaican ($90,581, a difference of 0.14%), Spanish American ($90,322, a difference of 0.14%), and Immigrants from St. Vincent and the Grenadines ($90,094, a difference of 0.40%).
| Demographics | Rating | Rank | Median Family Income |
| Hmong | 0.3 /100 | #265 | Tragic $91,296 |
| Central Americans | 0.3 /100 | #266 | Tragic $91,087 |
| Mexican American Indians | 0.2 /100 | #267 | Tragic $90,918 |
| Cree | 0.2 /100 | #268 | Tragic $90,882 |
| Belizeans | 0.2 /100 | #269 | Tragic $90,880 |
| Jamaicans | 0.2 /100 | #270 | Tragic $90,581 |
| Iroquois | 0.2 /100 | #271 | Tragic $90,543 |
| Immigrants | Liberia | 0.2 /100 | #272 | Tragic $90,450 |
| Immigrants | Micronesia | 0.2 /100 | #273 | Tragic $90,345 |
| Spanish Americans | 0.2 /100 | #274 | Tragic $90,322 |
| Immigrants | St. Vincent and the Grenadines | 0.2 /100 | #275 | Tragic $90,094 |
| Immigrants | Zaire | 0.1 /100 | #276 | Tragic $89,285 |
| Immigrants | Jamaica | 0.1 /100 | #277 | Tragic $89,268 |
| Immigrants | Grenada | 0.1 /100 | #278 | Tragic $89,249 |
| Immigrants | Belize | 0.1 /100 | #279 | Tragic $89,197 |
Demographics Similar to Hopi by Median Family Income
In terms of median family income, the demographic groups most similar to Hopi are Pima ($77,431, a difference of 0.32%), Immigrants from Yemen ($77,457, a difference of 0.35%), Pueblo ($76,880, a difference of 0.40%), Crow ($76,605, a difference of 0.76%), and Yuman ($78,055, a difference of 1.1%).
| Demographics | Rating | Rank | Median Family Income |
| Kiowa | 0.0 /100 | #333 | Tragic $80,885 |
| Menominee | 0.0 /100 | #334 | Tragic $79,563 |
| Yup'ik | 0.0 /100 | #335 | Tragic $79,290 |
| Immigrants | Cuba | 0.0 /100 | #336 | Tragic $78,249 |
| Yuman | 0.0 /100 | #337 | Tragic $78,055 |
| Immigrants | Yemen | 0.0 /100 | #338 | Tragic $77,457 |
| Pima | 0.0 /100 | #339 | Tragic $77,431 |
| Hopi | 0.0 /100 | #340 | Tragic $77,188 |
| Pueblo | 0.0 /100 | #341 | Tragic $76,880 |
| Crow | 0.0 /100 | #342 | Tragic $76,605 |
| Houma | 0.0 /100 | #343 | Tragic $76,188 |
| Tohono O'odham | 0.0 /100 | #344 | Tragic $72,193 |
| Navajo | 0.0 /100 | #345 | Tragic $70,989 |
| Puerto Ricans | 0.0 /100 | #346 | Tragic $70,423 |
| Lumbee | 0.0 /100 | #347 | Tragic $68,679 |