Immigrants from Liberia vs Croatian Female Unemployment
COMPARE
Immigrants from Liberia
Croatian
Female Unemployment
Female Unemployment Comparison
Immigrants from Liberia
Croatians
5.6%
FEMALE UNEMPLOYMENT
1.5/ 100
METRIC RATING
244th/ 347
METRIC RANK
4.7%
FEMALE UNEMPLOYMENT
99.9/ 100
METRIC RATING
17th/ 347
METRIC RANK
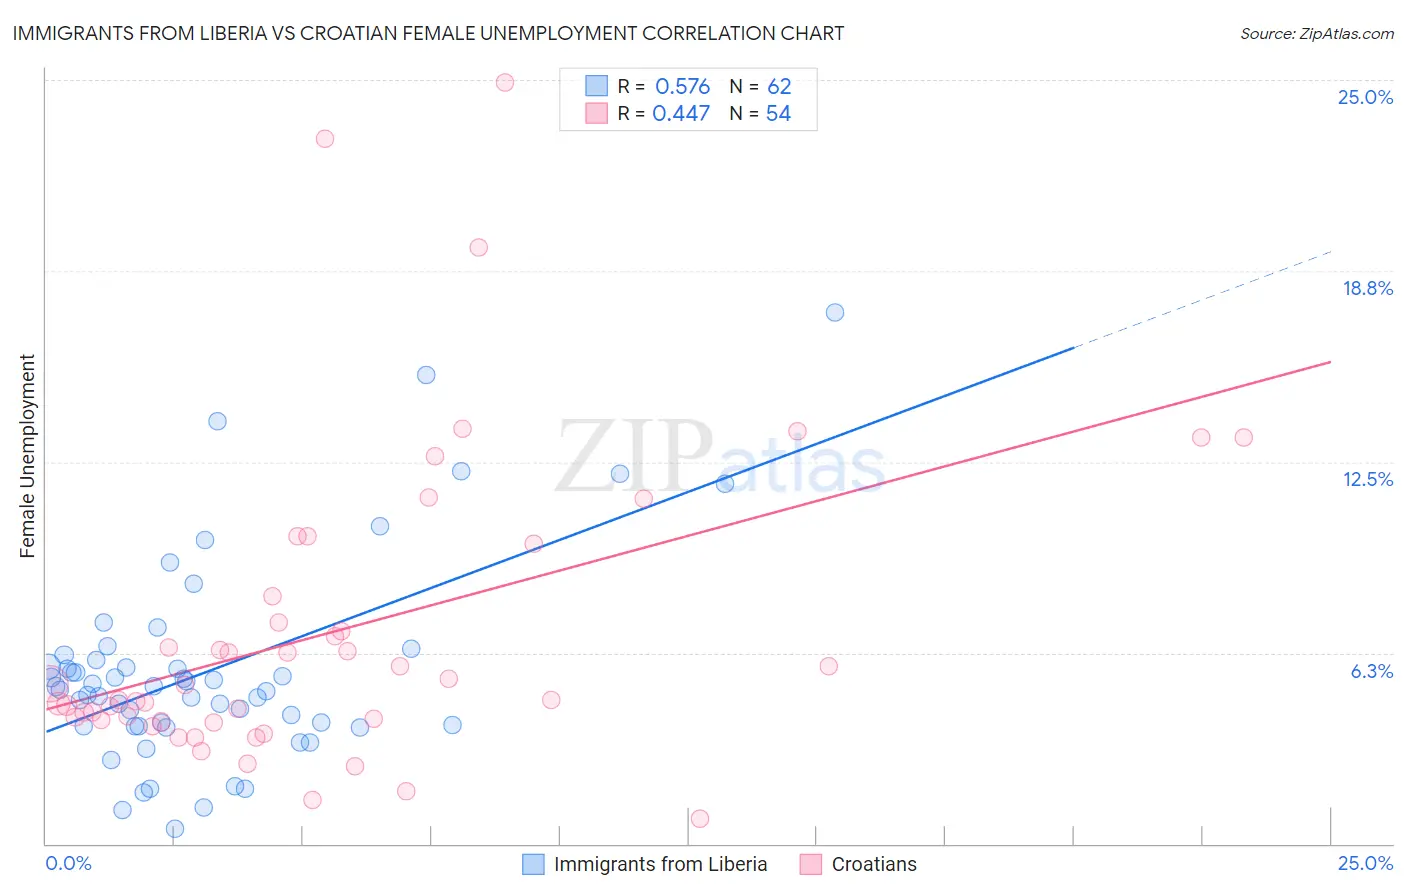
Immigrants from Liberia vs Croatian Female Unemployment Correlation Chart
The statistical analysis conducted on geographies consisting of 135,123,967 people shows a substantial positive correlation between the proportion of Immigrants from Liberia and unemploymnet rate among females in the United States with a correlation coefficient (R) of 0.576 and weighted average of 5.6%. Similarly, the statistical analysis conducted on geographies consisting of 373,417,382 people shows a moderate positive correlation between the proportion of Croatians and unemploymnet rate among females in the United States with a correlation coefficient (R) of 0.447 and weighted average of 4.7%, a difference of 19.5%.
Female Unemployment Correlation Summary
| Measurement | Immigrants from Liberia | Croatian |
| Minimum | 0.50% | 0.80% |
| Maximum | 17.4% | 24.9% |
| Range | 16.9% | 24.1% |
| Mean | 5.7% | 6.9% |
| Median | 5.1% | 4.9% |
| Interquartile 25% (IQ1) | 3.9% | 4.1% |
| Interquartile 75% (IQ3) | 6.0% | 8.1% |
| Interquartile Range (IQR) | 2.2% | 4.0% |
| Standard Deviation (Sample) | 3.3% | 5.0% |
| Standard Deviation (Population) | 3.3% | 5.0% |
Similar Demographics by Female Unemployment
Demographics Similar to Immigrants from Liberia by Female Unemployment
In terms of female unemployment, the demographic groups most similar to Immigrants from Liberia are Guamanian/Chamorro (5.6%, a difference of 0.14%), Japanese (5.6%, a difference of 0.37%), Immigrants from Western Asia (5.6%, a difference of 0.45%), Marshallese (5.6%, a difference of 0.55%), and Spanish American (5.6%, a difference of 0.55%).
| Demographics | Rating | Rank | Female Unemployment |
| Immigrants | Panama | 3.2 /100 | #237 | Tragic 5.5% |
| Sierra Leoneans | 3.2 /100 | #238 | Tragic 5.5% |
| Aleuts | 3.0 /100 | #239 | Tragic 5.5% |
| Immigrants | South America | 2.9 /100 | #240 | Tragic 5.5% |
| South American Indians | 2.8 /100 | #241 | Tragic 5.5% |
| Marshallese | 2.3 /100 | #242 | Tragic 5.6% |
| Spanish Americans | 2.2 /100 | #243 | Tragic 5.6% |
| Immigrants | Liberia | 1.5 /100 | #244 | Tragic 5.6% |
| Guamanians/Chamorros | 1.4 /100 | #245 | Tragic 5.6% |
| Japanese | 1.2 /100 | #246 | Tragic 5.6% |
| Immigrants | Western Asia | 1.1 /100 | #247 | Tragic 5.6% |
| Cree | 1.0 /100 | #248 | Tragic 5.6% |
| Immigrants | Uzbekistan | 1.0 /100 | #249 | Tragic 5.6% |
| Immigrants | Syria | 0.8 /100 | #250 | Tragic 5.6% |
| Assyrians/Chaldeans/Syriacs | 0.8 /100 | #251 | Tragic 5.6% |
Demographics Similar to Croatians by Female Unemployment
In terms of female unemployment, the demographic groups most similar to Croatians are Carpatho Rusyn (4.7%, a difference of 0.020%), Latvian (4.7%, a difference of 0.14%), Polish (4.7%, a difference of 0.16%), Bulgarian (4.7%, a difference of 0.24%), and Fijian (4.7%, a difference of 0.25%).
| Demographics | Rating | Rank | Female Unemployment |
| Swiss | 100.0 /100 | #10 | Exceptional 4.6% |
| Scandinavians | 100.0 /100 | #11 | Exceptional 4.6% |
| Dutch | 100.0 /100 | #12 | Exceptional 4.6% |
| Belgians | 100.0 /100 | #13 | Exceptional 4.6% |
| Finns | 100.0 /100 | #14 | Exceptional 4.6% |
| English | 100.0 /100 | #15 | Exceptional 4.6% |
| Carpatho Rusyns | 99.9 /100 | #16 | Exceptional 4.7% |
| Croatians | 99.9 /100 | #17 | Exceptional 4.7% |
| Latvians | 99.9 /100 | #18 | Exceptional 4.7% |
| Poles | 99.9 /100 | #19 | Exceptional 4.7% |
| Bulgarians | 99.9 /100 | #20 | Exceptional 4.7% |
| Fijians | 99.9 /100 | #21 | Exceptional 4.7% |
| Europeans | 99.9 /100 | #22 | Exceptional 4.7% |
| Scottish | 99.9 /100 | #23 | Exceptional 4.7% |
| Welsh | 99.9 /100 | #24 | Exceptional 4.7% |