Iranian vs Croatian Householder Income Ages 45 - 64 years
COMPARE
Iranian
Croatian
Householder Income Ages 45 - 64 years
Householder Income Ages 45 - 64 years Comparison
Iranians
Croatians
$129,350
HOUSEHOLDER INCOME AGES 45 - 64 YEARS
100.0/ 100
METRIC RATING
6th/ 347
METRIC RANK
$108,383
HOUSEHOLDER INCOME AGES 45 - 64 YEARS
98.3/ 100
METRIC RATING
92nd/ 347
METRIC RANK
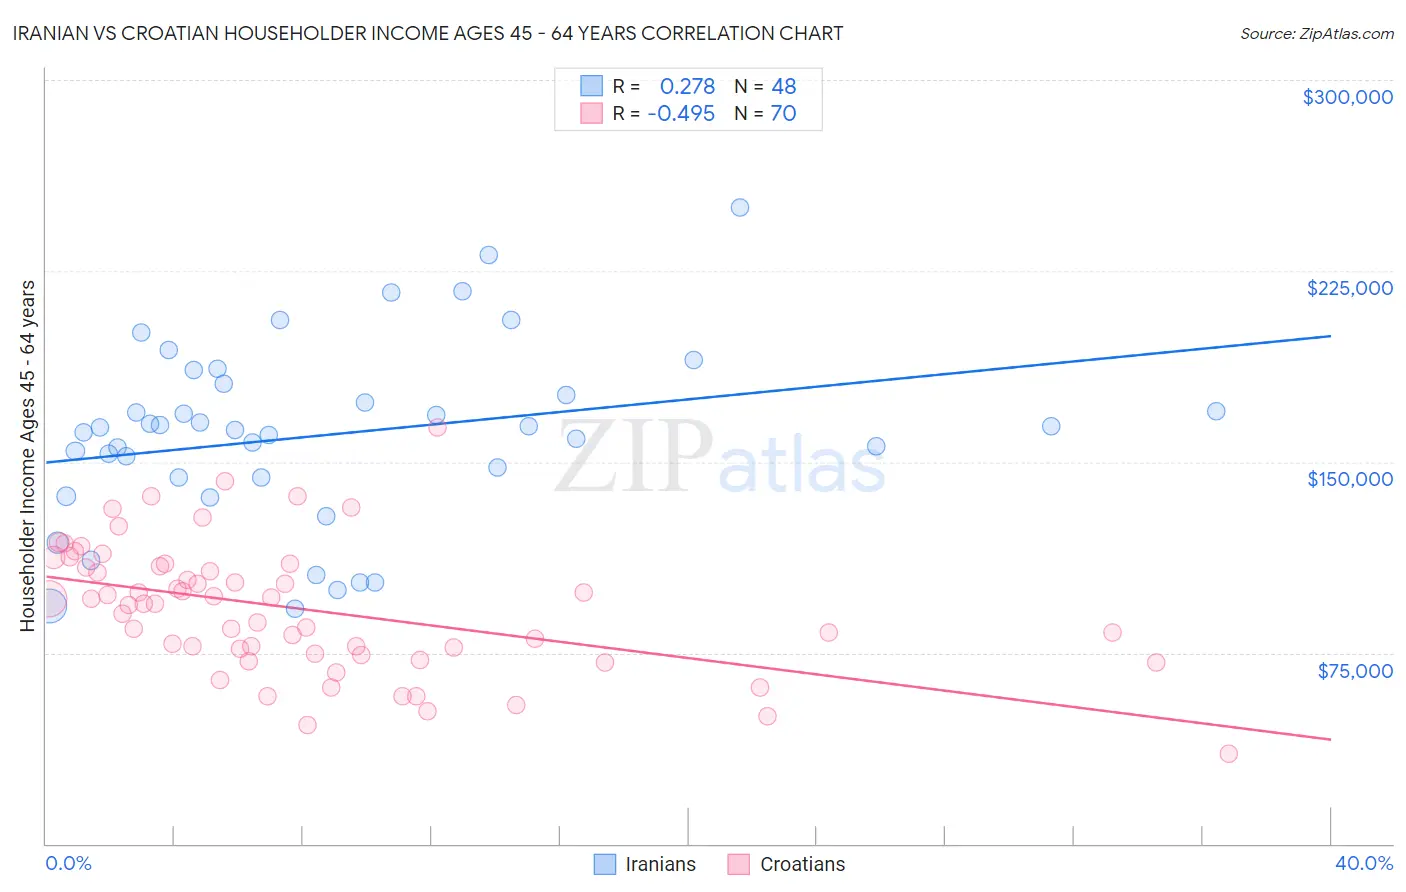
Iranian vs Croatian Householder Income Ages 45 - 64 years Correlation Chart
The statistical analysis conducted on geographies consisting of 316,454,523 people shows a weak positive correlation between the proportion of Iranians and household income with householder between the ages 45 and 64 in the United States with a correlation coefficient (R) of 0.278 and weighted average of $129,350. Similarly, the statistical analysis conducted on geographies consisting of 375,164,056 people shows a moderate negative correlation between the proportion of Croatians and household income with householder between the ages 45 and 64 in the United States with a correlation coefficient (R) of -0.495 and weighted average of $108,383, a difference of 19.3%.
Householder Income Ages 45 - 64 years Correlation Summary
| Measurement | Iranian | Croatian |
| Minimum | $92,091 | $35,326 |
| Maximum | $250,001 | $163,438 |
| Range | $157,910 | $128,112 |
| Mean | $160,647 | $92,198 |
| Median | $162,915 | $94,097 |
| Interquartile 25% (IQ1) | $143,809 | $74,551 |
| Interquartile 75% (IQ3) | $178,661 | $109,046 |
| Interquartile Range (IQR) | $34,851 | $34,495 |
| Standard Deviation (Sample) | $35,600 | $25,350 |
| Standard Deviation (Population) | $35,228 | $25,169 |
Similar Demographics by Householder Income Ages 45 - 64 years
Demographics Similar to Iranians by Householder Income Ages 45 - 64 years
In terms of householder income ages 45 - 64 years, the demographic groups most similar to Iranians are Immigrants from Singapore ($129,514, a difference of 0.13%), Thai ($129,560, a difference of 0.16%), Immigrants from Hong Kong ($127,500, a difference of 1.5%), Immigrants from Iran ($126,940, a difference of 1.9%), and Immigrants from India ($132,488, a difference of 2.4%).
| Demographics | Rating | Rank | Householder Income Ages 45 - 64 years |
| Immigrants | Taiwan | 100.0 /100 | #1 | Exceptional $135,508 |
| Filipinos | 100.0 /100 | #2 | Exceptional $134,910 |
| Immigrants | India | 100.0 /100 | #3 | Exceptional $132,488 |
| Thais | 100.0 /100 | #4 | Exceptional $129,560 |
| Immigrants | Singapore | 100.0 /100 | #5 | Exceptional $129,514 |
| Iranians | 100.0 /100 | #6 | Exceptional $129,350 |
| Immigrants | Hong Kong | 100.0 /100 | #7 | Exceptional $127,500 |
| Immigrants | Iran | 100.0 /100 | #8 | Exceptional $126,940 |
| Okinawans | 100.0 /100 | #9 | Exceptional $124,796 |
| Immigrants | South Central Asia | 100.0 /100 | #10 | Exceptional $124,188 |
| Cypriots | 100.0 /100 | #11 | Exceptional $123,396 |
| Immigrants | Israel | 100.0 /100 | #12 | Exceptional $122,893 |
| Immigrants | Ireland | 100.0 /100 | #13 | Exceptional $122,757 |
| Indians (Asian) | 100.0 /100 | #14 | Exceptional $122,343 |
| Immigrants | Eastern Asia | 100.0 /100 | #15 | Exceptional $122,222 |
Demographics Similar to Croatians by Householder Income Ages 45 - 64 years
In terms of householder income ages 45 - 64 years, the demographic groups most similar to Croatians are Immigrants from Croatia ($108,304, a difference of 0.070%), Ukrainian ($108,475, a difference of 0.080%), Immigrants from Philippines ($108,471, a difference of 0.080%), Immigrants from Lebanon ($108,471, a difference of 0.080%), and Sri Lankan ($108,270, a difference of 0.10%).
| Demographics | Rating | Rank | Householder Income Ages 45 - 64 years |
| Immigrants | Afghanistan | 98.6 /100 | #85 | Exceptional $108,785 |
| Austrians | 98.5 /100 | #86 | Exceptional $108,692 |
| Tongans | 98.5 /100 | #87 | Exceptional $108,643 |
| Romanians | 98.5 /100 | #88 | Exceptional $108,609 |
| Ukrainians | 98.3 /100 | #89 | Exceptional $108,475 |
| Immigrants | Philippines | 98.3 /100 | #90 | Exceptional $108,471 |
| Immigrants | Lebanon | 98.3 /100 | #91 | Exceptional $108,471 |
| Croatians | 98.3 /100 | #92 | Exceptional $108,383 |
| Immigrants | Croatia | 98.2 /100 | #93 | Exceptional $108,304 |
| Sri Lankans | 98.2 /100 | #94 | Exceptional $108,270 |
| Immigrants | Hungary | 98.2 /100 | #95 | Exceptional $108,267 |
| Immigrants | Argentina | 98.2 /100 | #96 | Exceptional $108,264 |
| Northern Europeans | 97.8 /100 | #97 | Exceptional $107,870 |
| Immigrants | Southern Europe | 97.7 /100 | #98 | Exceptional $107,775 |
| Palestinians | 97.6 /100 | #99 | Exceptional $107,721 |