Immigrants from Lebanon vs Kenyan Householder Income Under 25 years
COMPARE
Immigrants from Lebanon
Kenyan
Householder Income Under 25 years
Householder Income Under 25 years Comparison
Immigrants from Lebanon
Kenyans
$50,729
HOUSEHOLDER INCOME UNDER 25 YEARS
2.7/ 100
METRIC RATING
240th/ 347
METRIC RANK
$50,815
HOUSEHOLDER INCOME UNDER 25 YEARS
3.3/ 100
METRIC RATING
234th/ 347
METRIC RANK
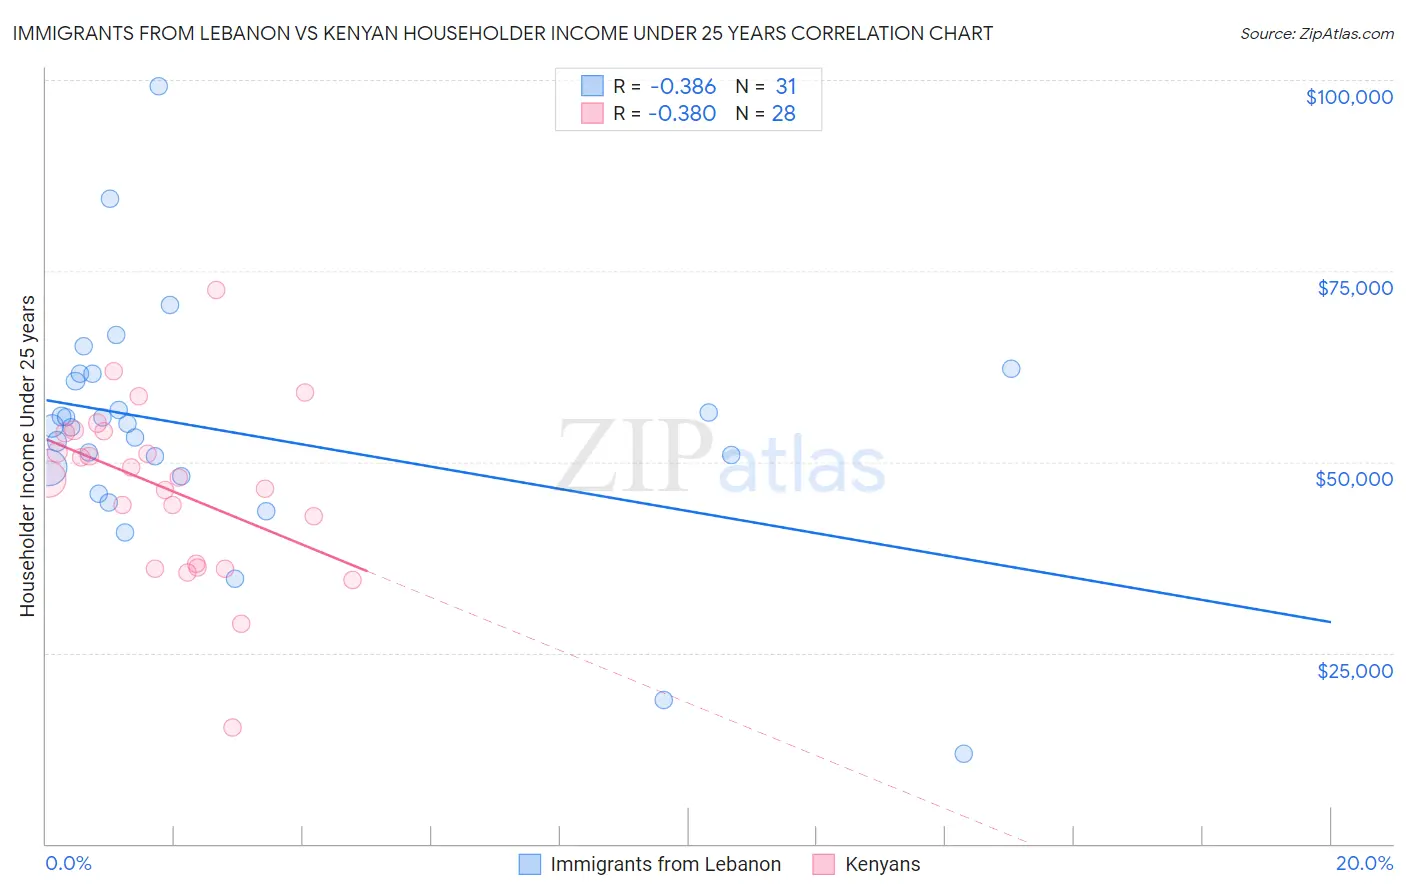
Immigrants from Lebanon vs Kenyan Householder Income Under 25 years Correlation Chart
The statistical analysis conducted on geographies consisting of 191,197,334 people shows a mild negative correlation between the proportion of Immigrants from Lebanon and household income with householder under the age of 25 in the United States with a correlation coefficient (R) of -0.386 and weighted average of $50,729. Similarly, the statistical analysis conducted on geographies consisting of 155,087,002 people shows a mild negative correlation between the proportion of Kenyans and household income with householder under the age of 25 in the United States with a correlation coefficient (R) of -0.380 and weighted average of $50,815, a difference of 0.17%.
Householder Income Under 25 years Correlation Summary
| Measurement | Immigrants from Lebanon | Kenyan |
| Minimum | $11,835 | $15,272 |
| Maximum | $99,135 | $72,514 |
| Range | $87,300 | $57,242 |
| Mean | $53,966 | $46,465 |
| Median | $54,687 | $47,808 |
| Interquartile 25% (IQ1) | $48,163 | $36,370 |
| Interquartile 75% (IQ3) | $61,480 | $53,945 |
| Interquartile Range (IQR) | $13,317 | $17,574 |
| Standard Deviation (Sample) | $15,995 | $11,475 |
| Standard Deviation (Population) | $15,734 | $11,268 |
Demographics Similar to Immigrants from Lebanon and Kenyans by Householder Income Under 25 years
In terms of householder income under 25 years, the demographic groups most similar to Immigrants from Lebanon are Immigrants from Caribbean ($50,757, a difference of 0.050%), Immigrants from Micronesia ($50,691, a difference of 0.080%), Iraqi ($50,802, a difference of 0.14%), English ($50,805, a difference of 0.15%), and German ($50,804, a difference of 0.15%). Similarly, the demographic groups most similar to Kenyans are Spanish ($50,813, a difference of 0.0%), English ($50,805, a difference of 0.020%), German ($50,804, a difference of 0.020%), Iraqi ($50,802, a difference of 0.030%), and Pennsylvania German ($50,852, a difference of 0.070%).
| Demographics | Rating | Rank | Householder Income Under 25 years |
| Immigrants | Central America | 5.4 /100 | #227 | Tragic $51,022 |
| Immigrants | Norway | 5.0 /100 | #228 | Tragic $50,984 |
| Yuman | 4.4 /100 | #229 | Tragic $50,933 |
| Jamaicans | 4.4 /100 | #230 | Tragic $50,929 |
| Ugandans | 4.3 /100 | #231 | Tragic $50,923 |
| Slovenes | 4.0 /100 | #232 | Tragic $50,886 |
| Pennsylvania Germans | 3.7 /100 | #233 | Tragic $50,852 |
| Kenyans | 3.3 /100 | #234 | Tragic $50,815 |
| Spanish | 3.3 /100 | #235 | Tragic $50,813 |
| English | 3.3 /100 | #236 | Tragic $50,805 |
| Germans | 3.3 /100 | #237 | Tragic $50,804 |
| Iraqis | 3.2 /100 | #238 | Tragic $50,802 |
| Immigrants | Caribbean | 2.9 /100 | #239 | Tragic $50,757 |
| Immigrants | Lebanon | 2.7 /100 | #240 | Tragic $50,729 |
| Immigrants | Micronesia | 2.5 /100 | #241 | Tragic $50,691 |
| Cubans | 2.3 /100 | #242 | Tragic $50,655 |
| Immigrants | Thailand | 2.2 /100 | #243 | Tragic $50,645 |
| Marshallese | 2.1 /100 | #244 | Tragic $50,627 |
| Immigrants | Africa | 2.0 /100 | #245 | Tragic $50,609 |
| Welsh | 2.0 /100 | #246 | Tragic $50,597 |
| Immigrants | Bosnia and Herzegovina | 1.8 /100 | #247 | Tragic $50,565 |