Immigrants from Latvia vs Immigrants from Lebanon Median Household Income
COMPARE
Immigrants from Latvia
Immigrants from Lebanon
Median Household Income
Median Household Income Comparison
Immigrants from Latvia
Immigrants from Lebanon
$93,602
MEDIAN HOUSEHOLD INCOME
99.6/ 100
METRIC RATING
74th/ 347
METRIC RANK
$91,887
MEDIAN HOUSEHOLD INCOME
98.7/ 100
METRIC RATING
93rd/ 347
METRIC RANK
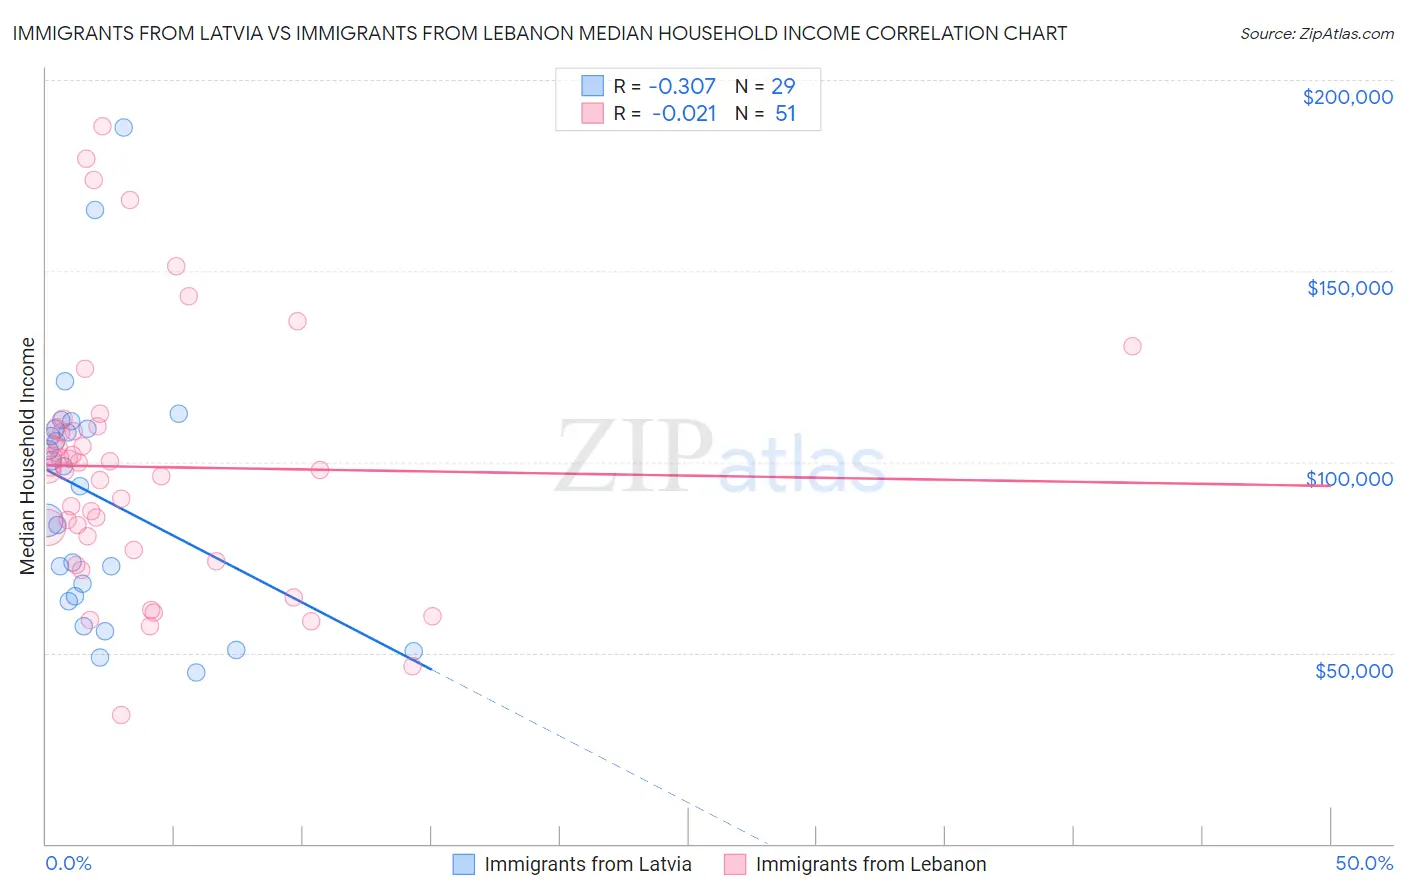
Immigrants from Latvia vs Immigrants from Lebanon Median Household Income Correlation Chart
The statistical analysis conducted on geographies consisting of 113,726,313 people shows a mild negative correlation between the proportion of Immigrants from Latvia and median household income in the United States with a correlation coefficient (R) of -0.307 and weighted average of $93,602. Similarly, the statistical analysis conducted on geographies consisting of 217,104,456 people shows no correlation between the proportion of Immigrants from Lebanon and median household income in the United States with a correlation coefficient (R) of -0.021 and weighted average of $91,887, a difference of 1.9%.
Median Household Income Correlation Summary
| Measurement | Immigrants from Latvia | Immigrants from Lebanon |
| Minimum | $44,737 | $33,750 |
| Maximum | $187,593 | $187,750 |
| Range | $142,856 | $154,000 |
| Mean | $90,790 | $98,672 |
| Median | $93,558 | $97,787 |
| Interquartile 25% (IQ1) | $64,215 | $76,889 |
| Interquartile 75% (IQ3) | $108,638 | $108,907 |
| Interquartile Range (IQR) | $44,423 | $32,018 |
| Standard Deviation (Sample) | $33,495 | $33,219 |
| Standard Deviation (Population) | $32,912 | $32,891 |
Demographics Similar to Immigrants from Latvia and Immigrants from Lebanon by Median Household Income
In terms of median household income, the demographic groups most similar to Immigrants from Latvia are Immigrants from Egypt ($93,700, a difference of 0.10%), Immigrants from Italy ($93,465, a difference of 0.15%), South African ($93,379, a difference of 0.24%), Immigrants from Afghanistan ($93,375, a difference of 0.24%), and Immigrants from Bulgaria ($93,148, a difference of 0.49%). Similarly, the demographic groups most similar to Immigrants from Lebanon are Immigrants from Western Europe ($91,936, a difference of 0.050%), Assyrian/Chaldean/Syriac ($91,991, a difference of 0.11%), Immigrants from Vietnam ($91,987, a difference of 0.11%), Romanian ($91,994, a difference of 0.12%), and Immigrants from Canada ($92,029, a difference of 0.15%).
| Demographics | Rating | Rank | Median Household Income |
| Immigrants | Egypt | 99.6 /100 | #73 | Exceptional $93,700 |
| Immigrants | Latvia | 99.6 /100 | #74 | Exceptional $93,602 |
| Immigrants | Italy | 99.5 /100 | #75 | Exceptional $93,465 |
| South Africans | 99.5 /100 | #76 | Exceptional $93,379 |
| Immigrants | Afghanistan | 99.5 /100 | #77 | Exceptional $93,375 |
| Immigrants | Bulgaria | 99.4 /100 | #78 | Exceptional $93,148 |
| Sri Lankans | 99.4 /100 | #79 | Exceptional $93,093 |
| Tongans | 99.4 /100 | #80 | Exceptional $93,076 |
| Immigrants | Eastern Europe | 99.4 /100 | #81 | Exceptional $93,051 |
| Immigrants | Spain | 99.3 /100 | #82 | Exceptional $92,732 |
| Italians | 99.1 /100 | #83 | Exceptional $92,475 |
| Immigrants | Argentina | 99.1 /100 | #84 | Exceptional $92,417 |
| Immigrants | Croatia | 99.0 /100 | #85 | Exceptional $92,225 |
| Immigrants | England | 98.9 /100 | #86 | Exceptional $92,098 |
| Immigrants | Hungary | 98.9 /100 | #87 | Exceptional $92,094 |
| Immigrants | Canada | 98.8 /100 | #88 | Exceptional $92,029 |
| Romanians | 98.8 /100 | #89 | Exceptional $91,994 |
| Assyrians/Chaldeans/Syriacs | 98.8 /100 | #90 | Exceptional $91,991 |
| Immigrants | Vietnam | 98.8 /100 | #91 | Exceptional $91,987 |
| Immigrants | Western Europe | 98.8 /100 | #92 | Exceptional $91,936 |
| Immigrants | Lebanon | 98.7 /100 | #93 | Exceptional $91,887 |