Immigrants from Latvia vs Immigrants from Czechoslovakia Disability Age 18 to 34
COMPARE
Immigrants from Latvia
Immigrants from Czechoslovakia
Disability Age 18 to 34
Disability Age 18 to 34 Comparison
Immigrants from Latvia
Immigrants from Czechoslovakia
6.4%
DISABILITY AGE 18 TO 34
86.4/ 100
METRIC RATING
143rd/ 347
METRIC RANK
6.3%
DISABILITY AGE 18 TO 34
93.3/ 100
METRIC RATING
122nd/ 347
METRIC RANK
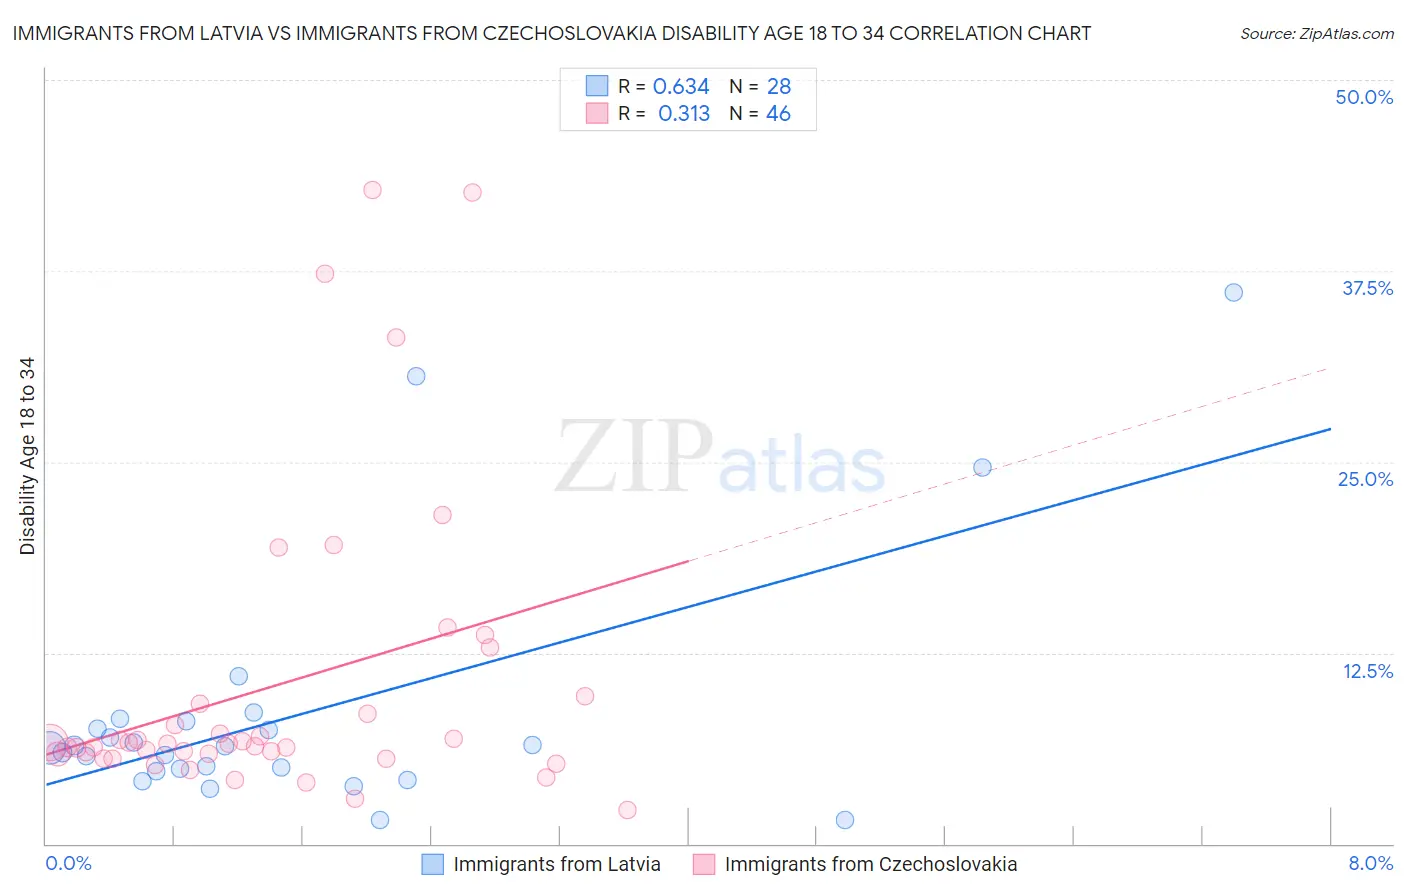
Immigrants from Latvia vs Immigrants from Czechoslovakia Disability Age 18 to 34 Correlation Chart
The statistical analysis conducted on geographies consisting of 113,671,079 people shows a significant positive correlation between the proportion of Immigrants from Latvia and percentage of population with a disability between the ages 18 and 35 in the United States with a correlation coefficient (R) of 0.634 and weighted average of 6.4%. Similarly, the statistical analysis conducted on geographies consisting of 195,199,094 people shows a mild positive correlation between the proportion of Immigrants from Czechoslovakia and percentage of population with a disability between the ages 18 and 35 in the United States with a correlation coefficient (R) of 0.313 and weighted average of 6.3%, a difference of 1.4%.
Disability Age 18 to 34 Correlation Summary
| Measurement | Immigrants from Latvia | Immigrants from Czechoslovakia |
| Minimum | 1.5% | 2.2% |
| Maximum | 36.1% | 42.8% |
| Range | 34.6% | 40.6% |
| Mean | 8.5% | 10.4% |
| Median | 6.3% | 6.6% |
| Interquartile 25% (IQ1) | 4.8% | 5.9% |
| Interquartile 75% (IQ3) | 7.8% | 9.1% |
| Interquartile Range (IQR) | 3.0% | 3.3% |
| Standard Deviation (Sample) | 8.2% | 9.9% |
| Standard Deviation (Population) | 8.0% | 9.8% |
Similar Demographics by Disability Age 18 to 34
Demographics Similar to Immigrants from Latvia by Disability Age 18 to 34
In terms of disability age 18 to 34, the demographic groups most similar to Immigrants from Latvia are South American Indian (6.4%, a difference of 0.020%), Jamaican (6.4%, a difference of 0.050%), Immigrants from Fiji (6.4%, a difference of 0.14%), Immigrants from Belize (6.4%, a difference of 0.16%), and Albanian (6.4%, a difference of 0.17%).
| Demographics | Rating | Rank | Disability Age 18 to 34 |
| Immigrants | Sweden | 88.5 /100 | #136 | Excellent 6.4% |
| Immigrants | Honduras | 87.7 /100 | #137 | Excellent 6.4% |
| Spanish American Indians | 87.7 /100 | #138 | Excellent 6.4% |
| Immigrants | Belize | 87.4 /100 | #139 | Excellent 6.4% |
| Immigrants | Fiji | 87.3 /100 | #140 | Excellent 6.4% |
| Jamaicans | 86.8 /100 | #141 | Excellent 6.4% |
| South American Indians | 86.5 /100 | #142 | Excellent 6.4% |
| Immigrants | Latvia | 86.4 /100 | #143 | Excellent 6.4% |
| Albanians | 85.3 /100 | #144 | Excellent 6.4% |
| Moroccans | 85.2 /100 | #145 | Excellent 6.4% |
| Belizeans | 84.9 /100 | #146 | Excellent 6.4% |
| Immigrants | South Africa | 83.7 /100 | #147 | Excellent 6.4% |
| Immigrants | Belgium | 83.5 /100 | #148 | Excellent 6.4% |
| Hondurans | 83.1 /100 | #149 | Excellent 6.4% |
| Immigrants | Dominican Republic | 82.7 /100 | #150 | Excellent 6.4% |
Demographics Similar to Immigrants from Czechoslovakia by Disability Age 18 to 34
In terms of disability age 18 to 34, the demographic groups most similar to Immigrants from Czechoslovakia are Immigrants from Ukraine (6.3%, a difference of 0.020%), Immigrants from Guatemala (6.3%, a difference of 0.020%), Chilean (6.3%, a difference of 0.050%), Immigrants from Nepal (6.3%, a difference of 0.11%), and Costa Rican (6.3%, a difference of 0.11%).
| Demographics | Rating | Rank | Disability Age 18 to 34 |
| Koreans | 94.1 /100 | #115 | Exceptional 6.3% |
| Immigrants | Costa Rica | 94.0 /100 | #116 | Exceptional 6.3% |
| Immigrants | Jordan | 94.0 /100 | #117 | Exceptional 6.3% |
| Immigrants | Nepal | 93.7 /100 | #118 | Exceptional 6.3% |
| Chileans | 93.5 /100 | #119 | Exceptional 6.3% |
| Immigrants | Ukraine | 93.4 /100 | #120 | Exceptional 6.3% |
| Immigrants | Guatemala | 93.4 /100 | #121 | Exceptional 6.3% |
| Immigrants | Czechoslovakia | 93.3 /100 | #122 | Exceptional 6.3% |
| Costa Ricans | 92.9 /100 | #123 | Exceptional 6.3% |
| Immigrants | Morocco | 92.9 /100 | #124 | Exceptional 6.3% |
| Macedonians | 92.6 /100 | #125 | Exceptional 6.3% |
| Immigrants | Switzerland | 92.5 /100 | #126 | Exceptional 6.3% |
| West Indians | 92.0 /100 | #127 | Exceptional 6.3% |
| Chinese | 91.9 /100 | #128 | Exceptional 6.3% |
| Immigrants | Italy | 90.5 /100 | #129 | Exceptional 6.3% |