Immigrants from Latin America vs Sri Lankan Per Capita Income
COMPARE
Immigrants from Latin America
Sri Lankan
Per Capita Income
Per Capita Income Comparison
Immigrants from Latin America
Sri Lankans
$36,823
PER CAPITA INCOME
0.0/ 100
METRIC RATING
307th/ 347
METRIC RANK
$44,014
PER CAPITA INCOME
59.8/ 100
METRIC RATING
164th/ 347
METRIC RANK
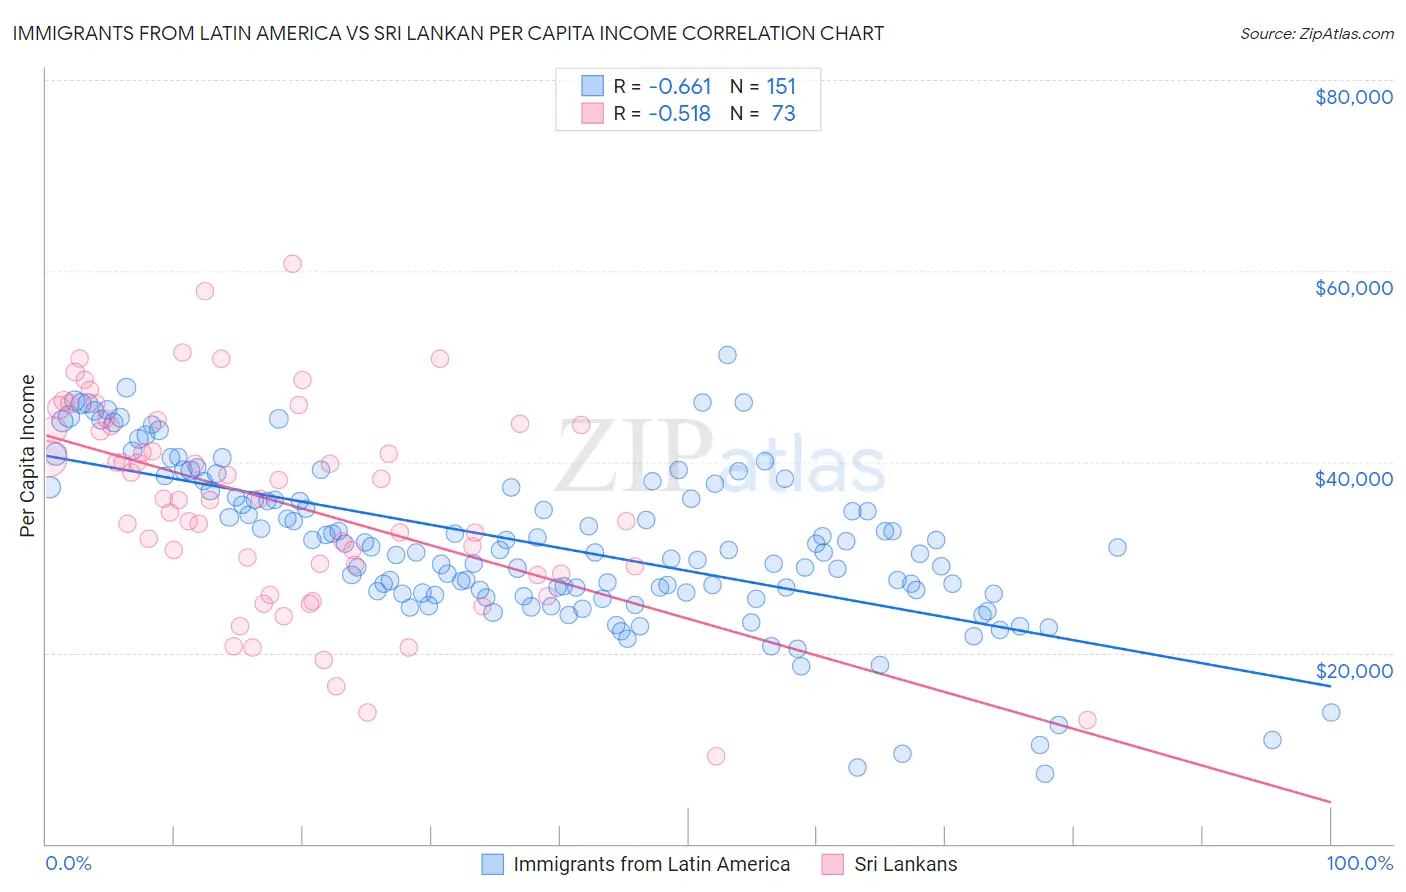
Immigrants from Latin America vs Sri Lankan Per Capita Income Correlation Chart
The statistical analysis conducted on geographies consisting of 558,689,902 people shows a significant negative correlation between the proportion of Immigrants from Latin America and per capita income in the United States with a correlation coefficient (R) of -0.661 and weighted average of $36,823. Similarly, the statistical analysis conducted on geographies consisting of 440,642,250 people shows a substantial negative correlation between the proportion of Sri Lankans and per capita income in the United States with a correlation coefficient (R) of -0.518 and weighted average of $44,014, a difference of 19.5%.
Per Capita Income Correlation Summary
| Measurement | Immigrants from Latin America | Sri Lankan |
| Minimum | $7,365 | $9,224 |
| Maximum | $51,138 | $60,722 |
| Range | $43,773 | $51,498 |
| Mean | $31,346 | $35,781 |
| Median | $30,830 | $36,115 |
| Interquartile 25% (IQ1) | $26,256 | $28,668 |
| Interquartile 75% (IQ3) | $37,351 | $43,934 |
| Interquartile Range (IQR) | $11,095 | $15,265 |
| Standard Deviation (Sample) | $8,475 | $10,742 |
| Standard Deviation (Population) | $8,446 | $10,669 |
Similar Demographics by Per Capita Income
Demographics Similar to Immigrants from Latin America by Per Capita Income
In terms of per capita income, the demographic groups most similar to Immigrants from Latin America are Immigrants from Haiti ($36,849, a difference of 0.070%), Fijian ($36,690, a difference of 0.36%), Immigrants from Honduras ($36,665, a difference of 0.43%), Ute ($36,651, a difference of 0.47%), and Inupiat ($36,999, a difference of 0.48%).
| Demographics | Rating | Rank | Per Capita Income |
| Immigrants | Bahamas | 0.1 /100 | #300 | Tragic $37,193 |
| Ottawa | 0.1 /100 | #301 | Tragic $37,101 |
| Shoshone | 0.1 /100 | #302 | Tragic $37,072 |
| Paiute | 0.1 /100 | #303 | Tragic $37,066 |
| Hondurans | 0.1 /100 | #304 | Tragic $37,031 |
| Inupiat | 0.1 /100 | #305 | Tragic $36,999 |
| Immigrants | Haiti | 0.0 /100 | #306 | Tragic $36,849 |
| Immigrants | Latin America | 0.0 /100 | #307 | Tragic $36,823 |
| Fijians | 0.0 /100 | #308 | Tragic $36,690 |
| Immigrants | Honduras | 0.0 /100 | #309 | Tragic $36,665 |
| Ute | 0.0 /100 | #310 | Tragic $36,651 |
| Chippewa | 0.0 /100 | #311 | Tragic $36,631 |
| Chickasaw | 0.0 /100 | #312 | Tragic $36,475 |
| Bahamians | 0.0 /100 | #313 | Tragic $36,427 |
| Seminole | 0.0 /100 | #314 | Tragic $36,180 |
Demographics Similar to Sri Lankans by Per Capita Income
In terms of per capita income, the demographic groups most similar to Sri Lankans are Immigrants from Philippines ($44,000, a difference of 0.030%), Immigrants from Uruguay ($43,997, a difference of 0.040%), English ($43,982, a difference of 0.070%), Immigrants from South America ($44,068, a difference of 0.12%), and Swiss ($44,076, a difference of 0.14%).
| Demographics | Rating | Rank | Per Capita Income |
| South American Indians | 64.8 /100 | #157 | Good $44,206 |
| Immigrants | Nepal | 64.3 /100 | #158 | Good $44,187 |
| South Americans | 62.4 /100 | #159 | Good $44,114 |
| Danes | 61.9 /100 | #160 | Good $44,095 |
| Costa Ricans | 61.8 /100 | #161 | Good $44,090 |
| Swiss | 61.4 /100 | #162 | Good $44,076 |
| Immigrants | South America | 61.2 /100 | #163 | Good $44,068 |
| Sri Lankans | 59.8 /100 | #164 | Average $44,014 |
| Immigrants | Philippines | 59.4 /100 | #165 | Average $44,000 |
| Immigrants | Uruguay | 59.3 /100 | #166 | Average $43,997 |
| English | 58.9 /100 | #167 | Average $43,982 |
| Belgians | 58.1 /100 | #168 | Average $43,951 |
| Immigrants | Peru | 55.3 /100 | #169 | Average $43,852 |
| Scandinavians | 55.2 /100 | #170 | Average $43,848 |
| Immigrants | Eastern Africa | 54.9 /100 | #171 | Average $43,838 |