Immigrants from Latin America vs Immigrants from Indonesia Median Earnings
COMPARE
Immigrants from Latin America
Immigrants from Indonesia
Median Earnings
Median Earnings Comparison
Immigrants from Latin America
Immigrants from Indonesia
$41,049
MEDIAN EARNINGS
0.1/ 100
METRIC RATING
301st/ 347
METRIC RANK
$51,715
MEDIAN EARNINGS
99.9/ 100
METRIC RATING
54th/ 347
METRIC RANK
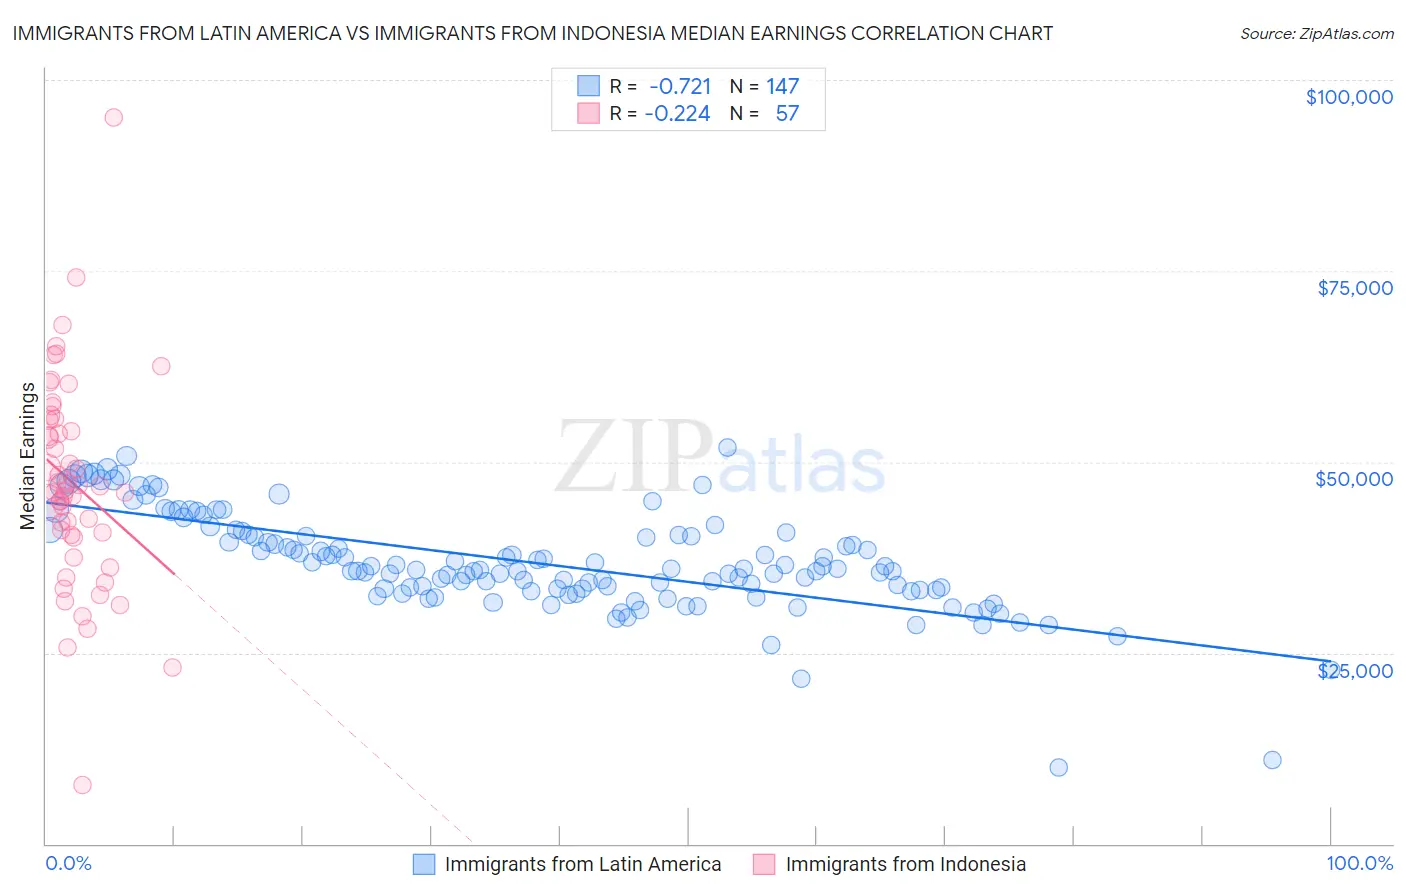
Immigrants from Latin America vs Immigrants from Indonesia Median Earnings Correlation Chart
The statistical analysis conducted on geographies consisting of 558,378,715 people shows a strong negative correlation between the proportion of Immigrants from Latin America and median earnings in the United States with a correlation coefficient (R) of -0.721 and weighted average of $41,049. Similarly, the statistical analysis conducted on geographies consisting of 215,769,238 people shows a weak negative correlation between the proportion of Immigrants from Indonesia and median earnings in the United States with a correlation coefficient (R) of -0.224 and weighted average of $51,715, a difference of 26.0%.
Median Earnings Correlation Summary
| Measurement | Immigrants from Latin America | Immigrants from Indonesia |
| Minimum | $9,917 | $7,703 |
| Maximum | $51,911 | $95,117 |
| Range | $41,994 | $87,414 |
| Mean | $36,860 | $47,201 |
| Median | $35,939 | $46,101 |
| Interquartile 25% (IQ1) | $33,290 | $40,269 |
| Interquartile 75% (IQ3) | $40,442 | $55,574 |
| Interquartile Range (IQR) | $7,152 | $15,305 |
| Standard Deviation (Sample) | $6,579 | $13,842 |
| Standard Deviation (Population) | $6,556 | $13,720 |
Similar Demographics by Median Earnings
Demographics Similar to Immigrants from Latin America by Median Earnings
In terms of median earnings, the demographic groups most similar to Immigrants from Latin America are Ute ($41,051, a difference of 0.010%), Immigrants from Caribbean ($41,119, a difference of 0.17%), Immigrants from Micronesia ($41,133, a difference of 0.20%), Shoshone ($40,932, a difference of 0.29%), and Haitian ($40,918, a difference of 0.32%).
| Demographics | Rating | Rank | Median Earnings |
| Potawatomi | 0.1 /100 | #294 | Tragic $41,288 |
| Bangladeshis | 0.1 /100 | #295 | Tragic $41,263 |
| Cherokee | 0.1 /100 | #296 | Tragic $41,252 |
| Guatemalans | 0.1 /100 | #297 | Tragic $41,205 |
| Immigrants | Micronesia | 0.1 /100 | #298 | Tragic $41,133 |
| Immigrants | Caribbean | 0.1 /100 | #299 | Tragic $41,119 |
| Ute | 0.1 /100 | #300 | Tragic $41,051 |
| Immigrants | Latin America | 0.1 /100 | #301 | Tragic $41,049 |
| Shoshone | 0.0 /100 | #302 | Tragic $40,932 |
| Haitians | 0.0 /100 | #303 | Tragic $40,918 |
| Immigrants | Guatemala | 0.0 /100 | #304 | Tragic $40,851 |
| Chickasaw | 0.0 /100 | #305 | Tragic $40,672 |
| Yaqui | 0.0 /100 | #306 | Tragic $40,647 |
| Hondurans | 0.0 /100 | #307 | Tragic $40,638 |
| Cubans | 0.0 /100 | #308 | Tragic $40,619 |
Demographics Similar to Immigrants from Indonesia by Median Earnings
In terms of median earnings, the demographic groups most similar to Immigrants from Indonesia are Egyptian ($51,701, a difference of 0.030%), Immigrants from Pakistan ($51,693, a difference of 0.040%), Immigrants from Norway ($51,758, a difference of 0.080%), Estonian ($51,772, a difference of 0.11%), and Immigrants from Eastern Europe ($51,624, a difference of 0.18%).
| Demographics | Rating | Rank | Median Earnings |
| Australians | 100.0 /100 | #47 | Exceptional $52,294 |
| Immigrants | Europe | 100.0 /100 | #48 | Exceptional $52,195 |
| Bolivians | 100.0 /100 | #49 | Exceptional $52,005 |
| Immigrants | South Africa | 100.0 /100 | #50 | Exceptional $51,850 |
| Immigrants | Austria | 99.9 /100 | #51 | Exceptional $51,826 |
| Estonians | 99.9 /100 | #52 | Exceptional $51,772 |
| Immigrants | Norway | 99.9 /100 | #53 | Exceptional $51,758 |
| Immigrants | Indonesia | 99.9 /100 | #54 | Exceptional $51,715 |
| Egyptians | 99.9 /100 | #55 | Exceptional $51,701 |
| Immigrants | Pakistan | 99.9 /100 | #56 | Exceptional $51,693 |
| Immigrants | Eastern Europe | 99.9 /100 | #57 | Exceptional $51,624 |
| Immigrants | Bolivia | 99.9 /100 | #58 | Exceptional $51,605 |
| Immigrants | Croatia | 99.9 /100 | #59 | Exceptional $51,581 |
| Immigrants | Serbia | 99.9 /100 | #60 | Exceptional $51,557 |
| Immigrants | Latvia | 99.9 /100 | #61 | Exceptional $51,555 |