Immigrants from Laos vs Somali Median Female Earnings
COMPARE
Immigrants from Laos
Somali
Median Female Earnings
Median Female Earnings Comparison
Immigrants from Laos
Somalis
$36,841
MEDIAN FEMALE EARNINGS
0.3/ 100
METRIC RATING
273rd/ 347
METRIC RANK
$38,333
MEDIAN FEMALE EARNINGS
5.5/ 100
METRIC RATING
231st/ 347
METRIC RANK
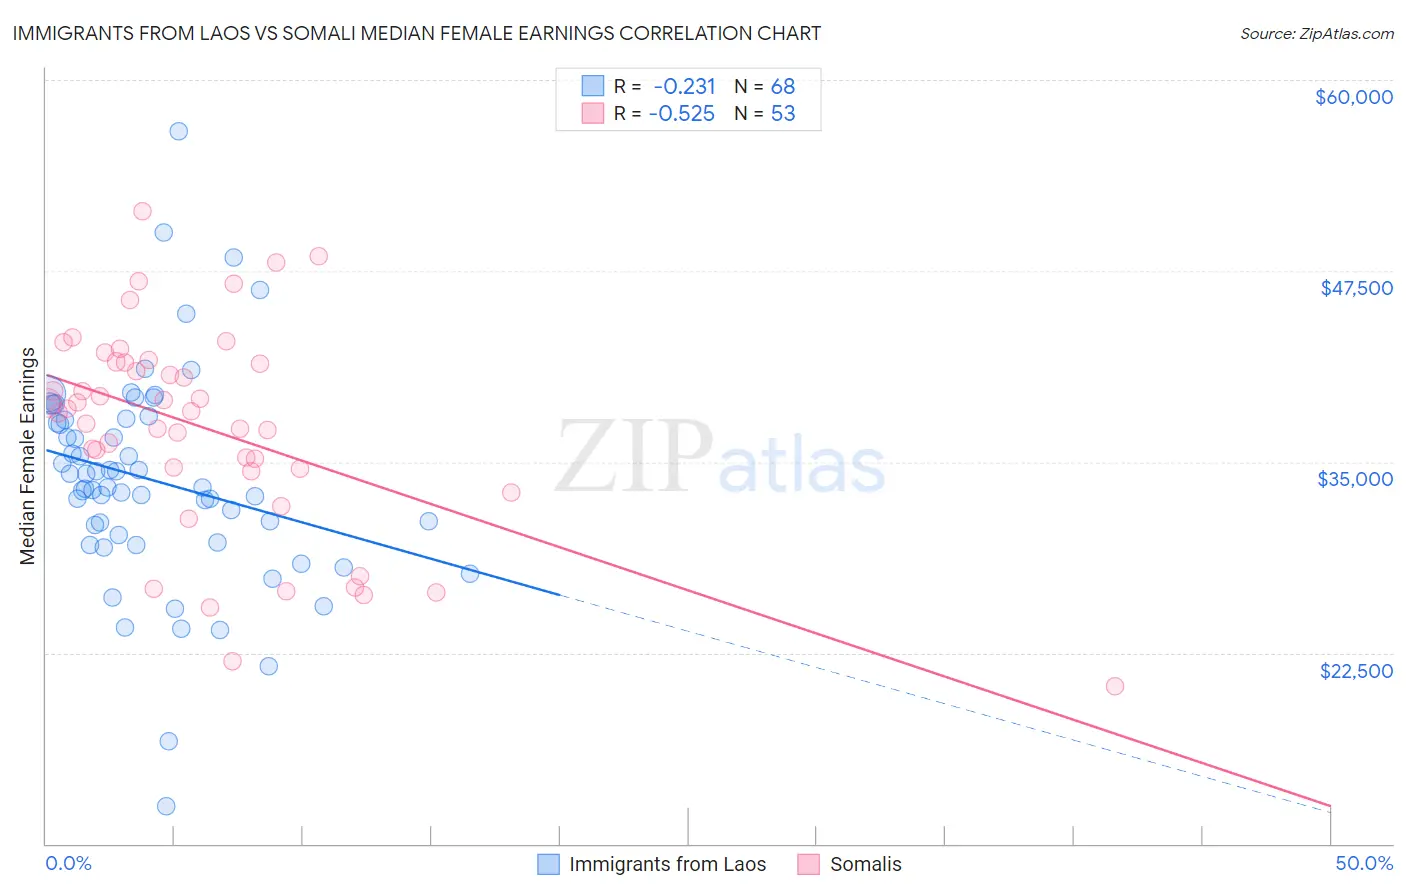
Immigrants from Laos vs Somali Median Female Earnings Correlation Chart
The statistical analysis conducted on geographies consisting of 201,447,053 people shows a weak negative correlation between the proportion of Immigrants from Laos and median female earnings in the United States with a correlation coefficient (R) of -0.231 and weighted average of $36,841. Similarly, the statistical analysis conducted on geographies consisting of 99,326,973 people shows a substantial negative correlation between the proportion of Somalis and median female earnings in the United States with a correlation coefficient (R) of -0.525 and weighted average of $38,333, a difference of 4.1%.
Median Female Earnings Correlation Summary
| Measurement | Immigrants from Laos | Somali |
| Minimum | $12,451 | $20,281 |
| Maximum | $56,635 | $51,368 |
| Range | $44,184 | $31,087 |
| Mean | $33,796 | $37,176 |
| Median | $33,308 | $38,333 |
| Interquartile 25% (IQ1) | $29,977 | $34,463 |
| Interquartile 75% (IQ3) | $37,781 | $41,523 |
| Interquartile Range (IQR) | $7,803 | $7,060 |
| Standard Deviation (Sample) | $7,087 | $6,829 |
| Standard Deviation (Population) | $7,035 | $6,765 |
Similar Demographics by Median Female Earnings
Demographics Similar to Immigrants from Laos by Median Female Earnings
In terms of median female earnings, the demographic groups most similar to Immigrants from Laos are Immigrants from Dominican Republic ($36,857, a difference of 0.040%), Nicaraguan ($36,904, a difference of 0.17%), French American Indian ($36,920, a difference of 0.21%), Immigrants from Venezuela ($37,003, a difference of 0.44%), and Immigrants from El Salvador ($36,673, a difference of 0.46%).
| Demographics | Rating | Rank | Median Female Earnings |
| Dominicans | 0.4 /100 | #266 | Tragic $37,046 |
| Immigrants | Nonimmigrants | 0.4 /100 | #267 | Tragic $37,024 |
| Cree | 0.4 /100 | #268 | Tragic $37,018 |
| Immigrants | Venezuela | 0.4 /100 | #269 | Tragic $37,003 |
| French American Indians | 0.3 /100 | #270 | Tragic $36,920 |
| Nicaraguans | 0.3 /100 | #271 | Tragic $36,904 |
| Immigrants | Dominican Republic | 0.3 /100 | #272 | Tragic $36,857 |
| Immigrants | Laos | 0.3 /100 | #273 | Tragic $36,841 |
| Immigrants | El Salvador | 0.2 /100 | #274 | Tragic $36,673 |
| Africans | 0.1 /100 | #275 | Tragic $36,530 |
| Central Americans | 0.1 /100 | #276 | Tragic $36,492 |
| Marshallese | 0.1 /100 | #277 | Tragic $36,459 |
| U.S. Virgin Islanders | 0.1 /100 | #278 | Tragic $36,424 |
| Immigrants | Caribbean | 0.1 /100 | #279 | Tragic $36,414 |
| Iroquois | 0.1 /100 | #280 | Tragic $36,408 |
Demographics Similar to Somalis by Median Female Earnings
In terms of median female earnings, the demographic groups most similar to Somalis are Basque ($38,352, a difference of 0.050%), Scandinavian ($38,306, a difference of 0.070%), Tongan ($38,288, a difference of 0.12%), Belgian ($38,382, a difference of 0.13%), and Celtic ($38,283, a difference of 0.13%).
| Demographics | Rating | Rank | Median Female Earnings |
| Native Hawaiians | 7.1 /100 | #224 | Tragic $38,461 |
| French | 7.0 /100 | #225 | Tragic $38,457 |
| French Canadians | 6.8 /100 | #226 | Tragic $38,436 |
| Scottish | 6.3 /100 | #227 | Tragic $38,397 |
| Sub-Saharan Africans | 6.2 /100 | #228 | Tragic $38,391 |
| Belgians | 6.1 /100 | #229 | Tragic $38,382 |
| Basques | 5.7 /100 | #230 | Tragic $38,352 |
| Somalis | 5.5 /100 | #231 | Tragic $38,333 |
| Scandinavians | 5.2 /100 | #232 | Tragic $38,306 |
| Tongans | 5.1 /100 | #233 | Tragic $38,288 |
| Celtics | 5.0 /100 | #234 | Tragic $38,283 |
| Sudanese | 4.4 /100 | #235 | Tragic $38,215 |
| Liberians | 4.4 /100 | #236 | Tragic $38,215 |
| Immigrants | Cabo Verde | 4.3 /100 | #237 | Tragic $38,208 |
| Alaska Natives | 4.3 /100 | #238 | Tragic $38,202 |