Immigrants from Philippines vs Somali Median Female Earnings
COMPARE
Immigrants from Philippines
Somali
Median Female Earnings
Median Female Earnings Comparison
Immigrants from Philippines
Somalis
$41,114
MEDIAN FEMALE EARNINGS
95.0/ 100
METRIC RATING
119th/ 347
METRIC RANK
$38,333
MEDIAN FEMALE EARNINGS
5.5/ 100
METRIC RATING
231st/ 347
METRIC RANK
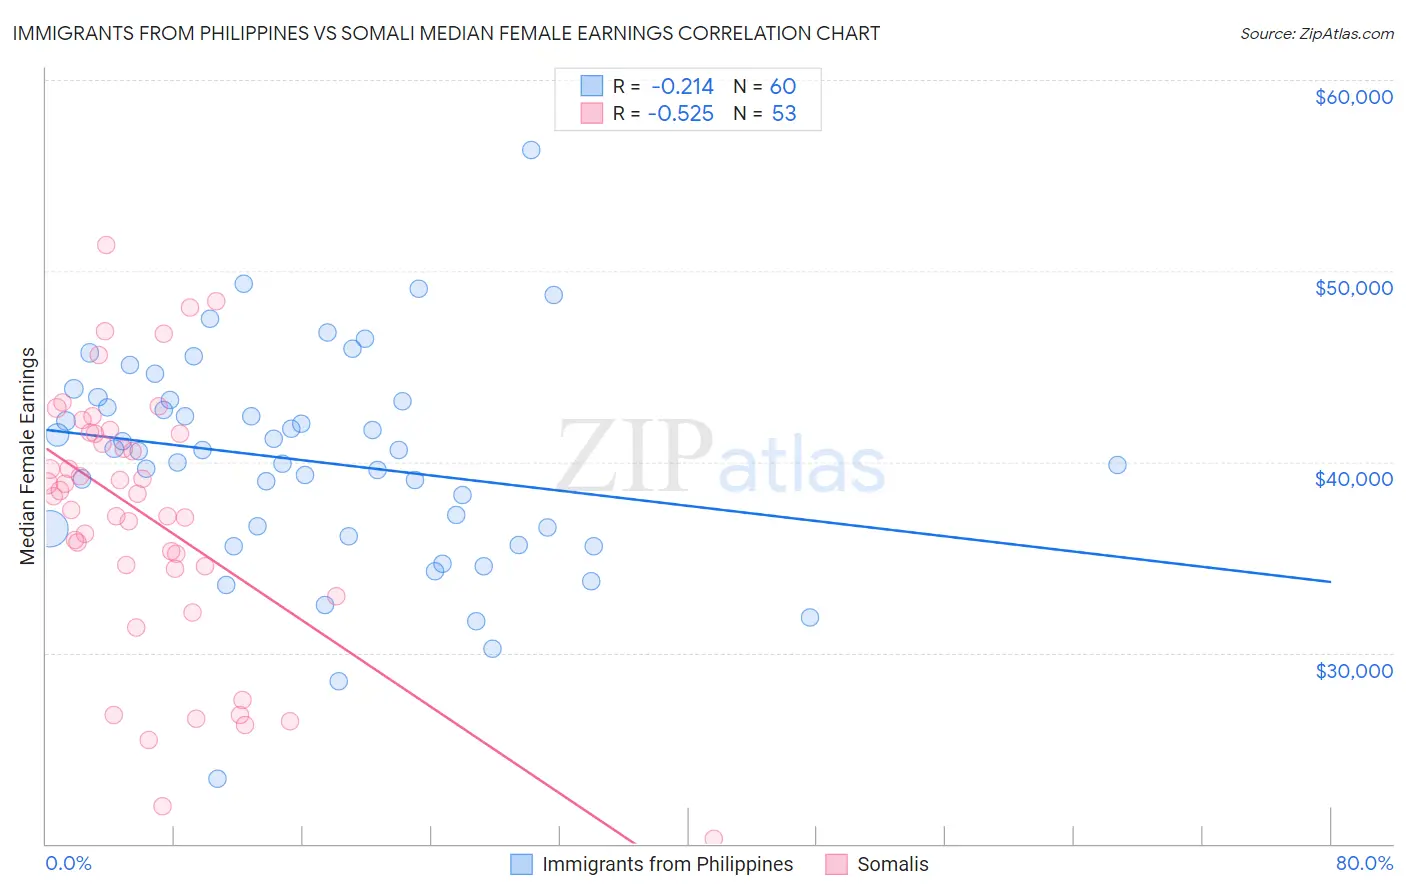
Immigrants from Philippines vs Somali Median Female Earnings Correlation Chart
The statistical analysis conducted on geographies consisting of 470,999,138 people shows a weak negative correlation between the proportion of Immigrants from Philippines and median female earnings in the United States with a correlation coefficient (R) of -0.214 and weighted average of $41,114. Similarly, the statistical analysis conducted on geographies consisting of 99,326,973 people shows a substantial negative correlation between the proportion of Somalis and median female earnings in the United States with a correlation coefficient (R) of -0.525 and weighted average of $38,333, a difference of 7.3%.
Median Female Earnings Correlation Summary
| Measurement | Immigrants from Philippines | Somali |
| Minimum | $23,405 | $20,281 |
| Maximum | $56,354 | $51,368 |
| Range | $32,949 | $31,087 |
| Mean | $40,018 | $37,176 |
| Median | $40,572 | $38,333 |
| Interquartile 25% (IQ1) | $36,304 | $34,463 |
| Interquartile 75% (IQ3) | $43,216 | $41,523 |
| Interquartile Range (IQR) | $6,912 | $7,060 |
| Standard Deviation (Sample) | $5,659 | $6,829 |
| Standard Deviation (Population) | $5,612 | $6,765 |
Similar Demographics by Median Female Earnings
Demographics Similar to Immigrants from Philippines by Median Female Earnings
In terms of median female earnings, the demographic groups most similar to Immigrants from Philippines are Immigrants from Kuwait ($41,055, a difference of 0.15%), Immigrants from Lebanon ($41,183, a difference of 0.17%), Croatian ($40,993, a difference of 0.30%), Immigrants from Jordan ($40,977, a difference of 0.33%), and Guyanese ($40,973, a difference of 0.34%).
| Demographics | Rating | Rank | Median Female Earnings |
| Immigrants | North America | 96.7 /100 | #112 | Exceptional $41,319 |
| Macedonians | 96.4 /100 | #113 | Exceptional $41,286 |
| Immigrants | England | 96.4 /100 | #114 | Exceptional $41,277 |
| Koreans | 96.4 /100 | #115 | Exceptional $41,276 |
| Immigrants | Brazil | 96.4 /100 | #116 | Exceptional $41,273 |
| Barbadians | 96.3 /100 | #117 | Exceptional $41,261 |
| Immigrants | Lebanon | 95.6 /100 | #118 | Exceptional $41,183 |
| Immigrants | Philippines | 95.0 /100 | #119 | Exceptional $41,114 |
| Immigrants | Kuwait | 94.4 /100 | #120 | Exceptional $41,055 |
| Croatians | 93.7 /100 | #121 | Exceptional $40,993 |
| Immigrants | Jordan | 93.5 /100 | #122 | Exceptional $40,977 |
| Guyanese | 93.4 /100 | #123 | Exceptional $40,973 |
| Trinidadians and Tobagonians | 93.2 /100 | #124 | Exceptional $40,958 |
| Austrians | 92.7 /100 | #125 | Exceptional $40,923 |
| Immigrants | Trinidad and Tobago | 92.3 /100 | #126 | Exceptional $40,895 |
Demographics Similar to Somalis by Median Female Earnings
In terms of median female earnings, the demographic groups most similar to Somalis are Basque ($38,352, a difference of 0.050%), Scandinavian ($38,306, a difference of 0.070%), Tongan ($38,288, a difference of 0.12%), Belgian ($38,382, a difference of 0.13%), and Celtic ($38,283, a difference of 0.13%).
| Demographics | Rating | Rank | Median Female Earnings |
| Native Hawaiians | 7.1 /100 | #224 | Tragic $38,461 |
| French | 7.0 /100 | #225 | Tragic $38,457 |
| French Canadians | 6.8 /100 | #226 | Tragic $38,436 |
| Scottish | 6.3 /100 | #227 | Tragic $38,397 |
| Sub-Saharan Africans | 6.2 /100 | #228 | Tragic $38,391 |
| Belgians | 6.1 /100 | #229 | Tragic $38,382 |
| Basques | 5.7 /100 | #230 | Tragic $38,352 |
| Somalis | 5.5 /100 | #231 | Tragic $38,333 |
| Scandinavians | 5.2 /100 | #232 | Tragic $38,306 |
| Tongans | 5.1 /100 | #233 | Tragic $38,288 |
| Celtics | 5.0 /100 | #234 | Tragic $38,283 |
| Sudanese | 4.4 /100 | #235 | Tragic $38,215 |
| Liberians | 4.4 /100 | #236 | Tragic $38,215 |
| Immigrants | Cabo Verde | 4.3 /100 | #237 | Tragic $38,208 |
| Alaska Natives | 4.3 /100 | #238 | Tragic $38,202 |