Immigrants from Laos vs Marshallese Median Household Income
COMPARE
Immigrants from Laos
Marshallese
Median Household Income
Median Household Income Comparison
Immigrants from Laos
Marshallese
$78,327
MEDIAN HOUSEHOLD INCOME
1.3/ 100
METRIC RATING
250th/ 347
METRIC RANK
$78,930
MEDIAN HOUSEHOLD INCOME
1.9/ 100
METRIC RATING
244th/ 347
METRIC RANK
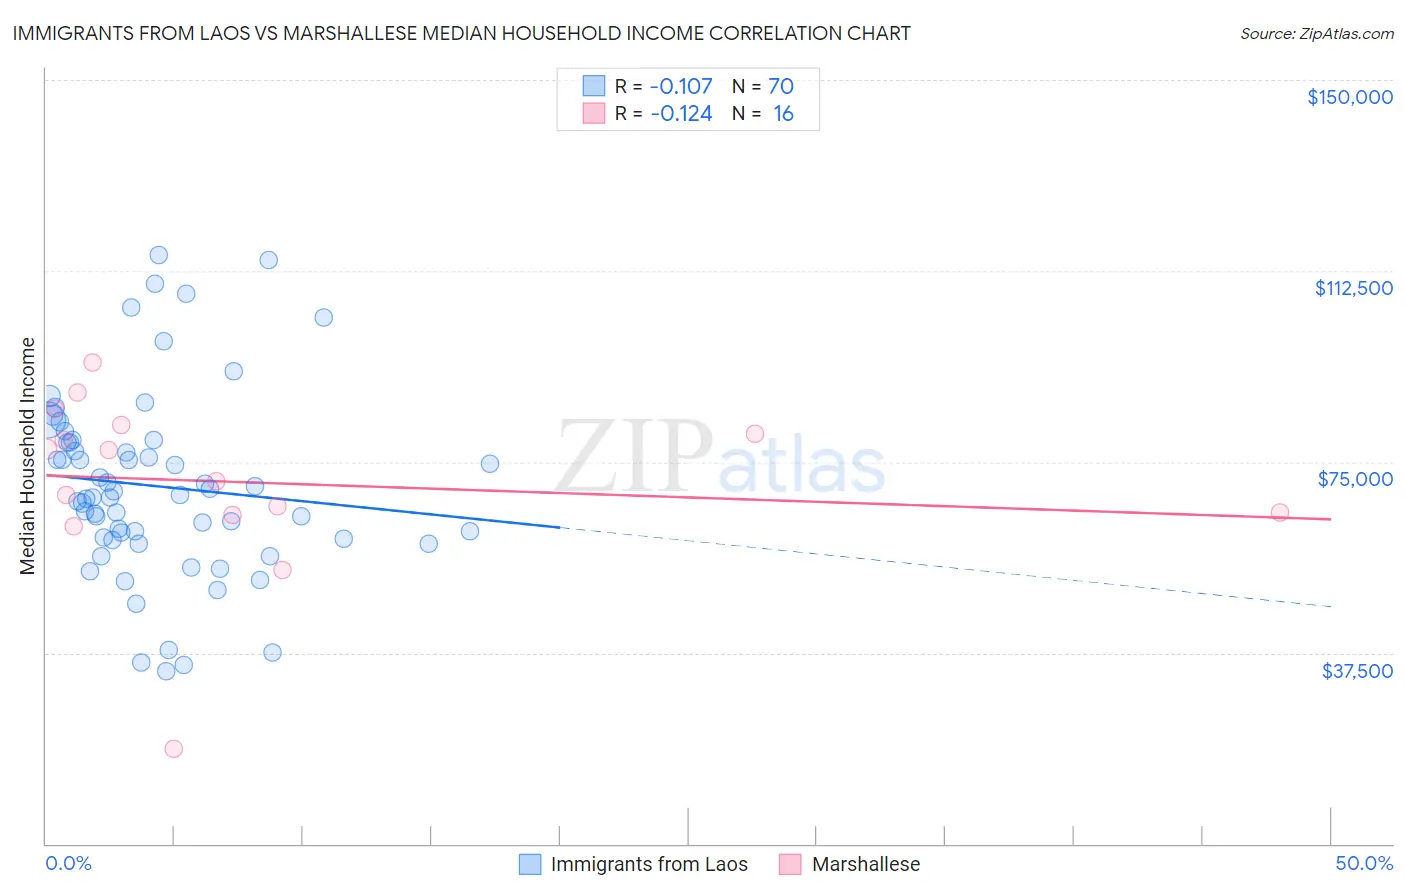
Immigrants from Laos vs Marshallese Median Household Income Correlation Chart
The statistical analysis conducted on geographies consisting of 201,460,424 people shows a poor negative correlation between the proportion of Immigrants from Laos and median household income in the United States with a correlation coefficient (R) of -0.107 and weighted average of $78,327. Similarly, the statistical analysis conducted on geographies consisting of 14,761,315 people shows a poor negative correlation between the proportion of Marshallese and median household income in the United States with a correlation coefficient (R) of -0.124 and weighted average of $78,930, a difference of 0.77%.
Median Household Income Correlation Summary
| Measurement | Immigrants from Laos | Marshallese |
| Minimum | $33,804 | $18,739 |
| Maximum | $115,579 | $94,608 |
| Range | $81,775 | $75,869 |
| Mean | $70,206 | $71,002 |
| Median | $68,245 | $74,280 |
| Interquartile 25% (IQ1) | $59,790 | $64,792 |
| Interquartile 75% (IQ3) | $78,877 | $81,406 |
| Interquartile Range (IQR) | $19,087 | $16,615 |
| Standard Deviation (Sample) | $18,088 | $17,620 |
| Standard Deviation (Population) | $17,959 | $17,060 |
Demographics Similar to Immigrants from Laos and Marshallese by Median Household Income
In terms of median household income, the demographic groups most similar to Immigrants from Laos are West Indian ($78,455, a difference of 0.16%), Mexican American Indian ($78,166, a difference of 0.21%), Sudanese ($78,529, a difference of 0.26%), Immigrants from Burma/Myanmar ($78,682, a difference of 0.45%), and Immigrants from West Indies ($77,956, a difference of 0.48%). Similarly, the demographic groups most similar to Marshallese are Immigrants from Barbados ($78,989, a difference of 0.080%), Inupiat ($78,841, a difference of 0.11%), Central American ($78,803, a difference of 0.16%), Immigrants from Sudan ($79,103, a difference of 0.22%), and Immigrants from Burma/Myanmar ($78,682, a difference of 0.32%).
| Demographics | Rating | Rank | Median Household Income |
| Nicaraguans | 3.1 /100 | #237 | Tragic $79,737 |
| Barbadians | 3.0 /100 | #238 | Tragic $79,664 |
| Alaska Natives | 2.7 /100 | #239 | Tragic $79,509 |
| Immigrants | Western Africa | 2.7 /100 | #240 | Tragic $79,490 |
| Immigrants | Nonimmigrants | 2.6 /100 | #241 | Tragic $79,429 |
| Immigrants | Sudan | 2.1 /100 | #242 | Tragic $79,103 |
| Immigrants | Barbados | 1.9 /100 | #243 | Tragic $78,989 |
| Marshallese | 1.9 /100 | #244 | Tragic $78,930 |
| Inupiat | 1.8 /100 | #245 | Tragic $78,841 |
| Central Americans | 1.7 /100 | #246 | Tragic $78,803 |
| Immigrants | Burma/Myanmar | 1.6 /100 | #247 | Tragic $78,682 |
| Sudanese | 1.5 /100 | #248 | Tragic $78,529 |
| West Indians | 1.4 /100 | #249 | Tragic $78,455 |
| Immigrants | Laos | 1.3 /100 | #250 | Tragic $78,327 |
| Mexican American Indians | 1.2 /100 | #251 | Tragic $78,166 |
| Immigrants | West Indies | 1.0 /100 | #252 | Tragic $77,956 |
| Immigrants | St. Vincent and the Grenadines | 0.9 /100 | #253 | Tragic $77,690 |
| Sub-Saharan Africans | 0.8 /100 | #254 | Tragic $77,631 |
| Immigrants | Middle Africa | 0.8 /100 | #255 | Tragic $77,559 |
| Belizeans | 0.6 /100 | #256 | Tragic $77,028 |
| Immigrants | Senegal | 0.5 /100 | #257 | Tragic $76,915 |