Immigrants from Korea vs Belgian Median Household Income
COMPARE
Immigrants from Korea
Belgian
Median Household Income
Median Household Income Comparison
Immigrants from Korea
Belgians
$102,962
MEDIAN HOUSEHOLD INCOME
100.0/ 100
METRIC RATING
17th/ 347
METRIC RANK
$84,008
MEDIAN HOUSEHOLD INCOME
33.2/ 100
METRIC RATING
187th/ 347
METRIC RANK
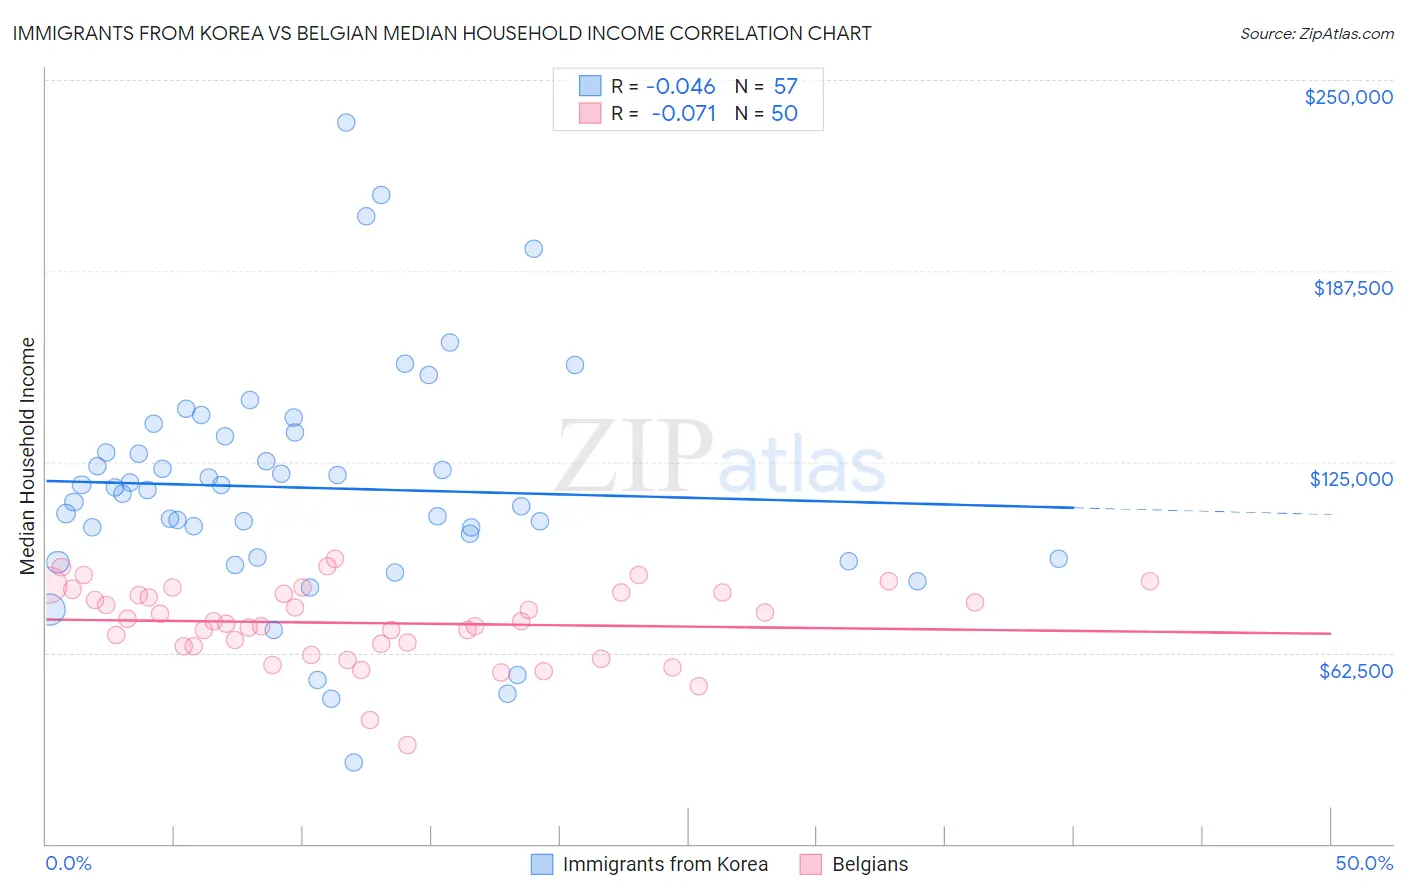
Immigrants from Korea vs Belgian Median Household Income Correlation Chart
The statistical analysis conducted on geographies consisting of 415,854,714 people shows no correlation between the proportion of Immigrants from Korea and median household income in the United States with a correlation coefficient (R) of -0.046 and weighted average of $102,962. Similarly, the statistical analysis conducted on geographies consisting of 355,773,334 people shows a slight negative correlation between the proportion of Belgians and median household income in the United States with a correlation coefficient (R) of -0.071 and weighted average of $84,008, a difference of 22.6%.
Median Household Income Correlation Summary
| Measurement | Immigrants from Korea | Belgian |
| Minimum | $26,550 | $32,500 |
| Maximum | $235,959 | $93,194 |
| Range | $209,409 | $60,694 |
| Mean | $116,491 | $72,191 |
| Median | $115,968 | $72,683 |
| Interquartile 25% (IQ1) | $93,452 | $64,851 |
| Interquartile 75% (IQ3) | $133,881 | $82,059 |
| Interquartile Range (IQR) | $40,429 | $17,208 |
| Standard Deviation (Sample) | $38,811 | $12,788 |
| Standard Deviation (Population) | $38,469 | $12,659 |
Similar Demographics by Median Household Income
Demographics Similar to Immigrants from Korea by Median Household Income
In terms of median household income, the demographic groups most similar to Immigrants from Korea are Cypriot ($102,843, a difference of 0.12%), Burmese ($103,145, a difference of 0.18%), Immigrants from Australia ($102,562, a difference of 0.39%), Bolivian ($102,195, a difference of 0.75%), and Immigrants from Israel ($104,090, a difference of 1.1%).
| Demographics | Rating | Rank | Median Household Income |
| Immigrants | South Central Asia | 100.0 /100 | #10 | Exceptional $106,057 |
| Immigrants | China | 100.0 /100 | #11 | Exceptional $105,335 |
| Indians (Asian) | 100.0 /100 | #12 | Exceptional $105,262 |
| Immigrants | Eastern Asia | 100.0 /100 | #13 | Exceptional $104,796 |
| Immigrants | Ireland | 100.0 /100 | #14 | Exceptional $104,692 |
| Immigrants | Israel | 100.0 /100 | #15 | Exceptional $104,090 |
| Burmese | 100.0 /100 | #16 | Exceptional $103,145 |
| Immigrants | Korea | 100.0 /100 | #17 | Exceptional $102,962 |
| Cypriots | 100.0 /100 | #18 | Exceptional $102,843 |
| Immigrants | Australia | 100.0 /100 | #19 | Exceptional $102,562 |
| Bolivians | 100.0 /100 | #20 | Exceptional $102,195 |
| Eastern Europeans | 100.0 /100 | #21 | Exceptional $101,781 |
| Asians | 100.0 /100 | #22 | Exceptional $101,681 |
| Immigrants | Bolivia | 100.0 /100 | #23 | Exceptional $101,394 |
| Immigrants | Japan | 100.0 /100 | #24 | Exceptional $100,711 |
Demographics Similar to Belgians by Median Household Income
In terms of median household income, the demographic groups most similar to Belgians are Puget Sound Salish ($84,011, a difference of 0.0%), Tlingit-Haida ($83,968, a difference of 0.050%), Kenyan ($84,085, a difference of 0.090%), Immigrants from Colombia ($83,902, a difference of 0.13%), and Slovak ($83,798, a difference of 0.25%).
| Demographics | Rating | Rank | Median Household Income |
| Immigrants | Portugal | 44.2 /100 | #180 | Average $84,740 |
| Hawaiians | 44.1 /100 | #181 | Average $84,729 |
| Uruguayans | 43.5 /100 | #182 | Average $84,691 |
| Spaniards | 42.7 /100 | #183 | Average $84,644 |
| Immigrants | Eastern Africa | 37.4 /100 | #184 | Fair $84,299 |
| Kenyans | 34.2 /100 | #185 | Fair $84,085 |
| Puget Sound Salish | 33.2 /100 | #186 | Fair $84,011 |
| Belgians | 33.2 /100 | #187 | Fair $84,008 |
| Tlingit-Haida | 32.6 /100 | #188 | Fair $83,968 |
| Immigrants | Colombia | 31.7 /100 | #189 | Fair $83,902 |
| Slovaks | 30.2 /100 | #190 | Fair $83,798 |
| Iraqis | 29.6 /100 | #191 | Fair $83,753 |
| Welsh | 28.0 /100 | #192 | Fair $83,628 |
| Finns | 27.7 /100 | #193 | Fair $83,607 |
| Ghanaians | 27.4 /100 | #194 | Fair $83,582 |