Immigrants from Kazakhstan vs White/Caucasian Per Capita Income
COMPARE
Immigrants from Kazakhstan
White/Caucasian
Per Capita Income
Per Capita Income Comparison
Immigrants from Kazakhstan
Whites/Caucasians
$48,747
PER CAPITA INCOME
99.7/ 100
METRIC RATING
77th/ 347
METRIC RANK
$42,180
PER CAPITA INCOME
15.9/ 100
METRIC RATING
205th/ 347
METRIC RANK
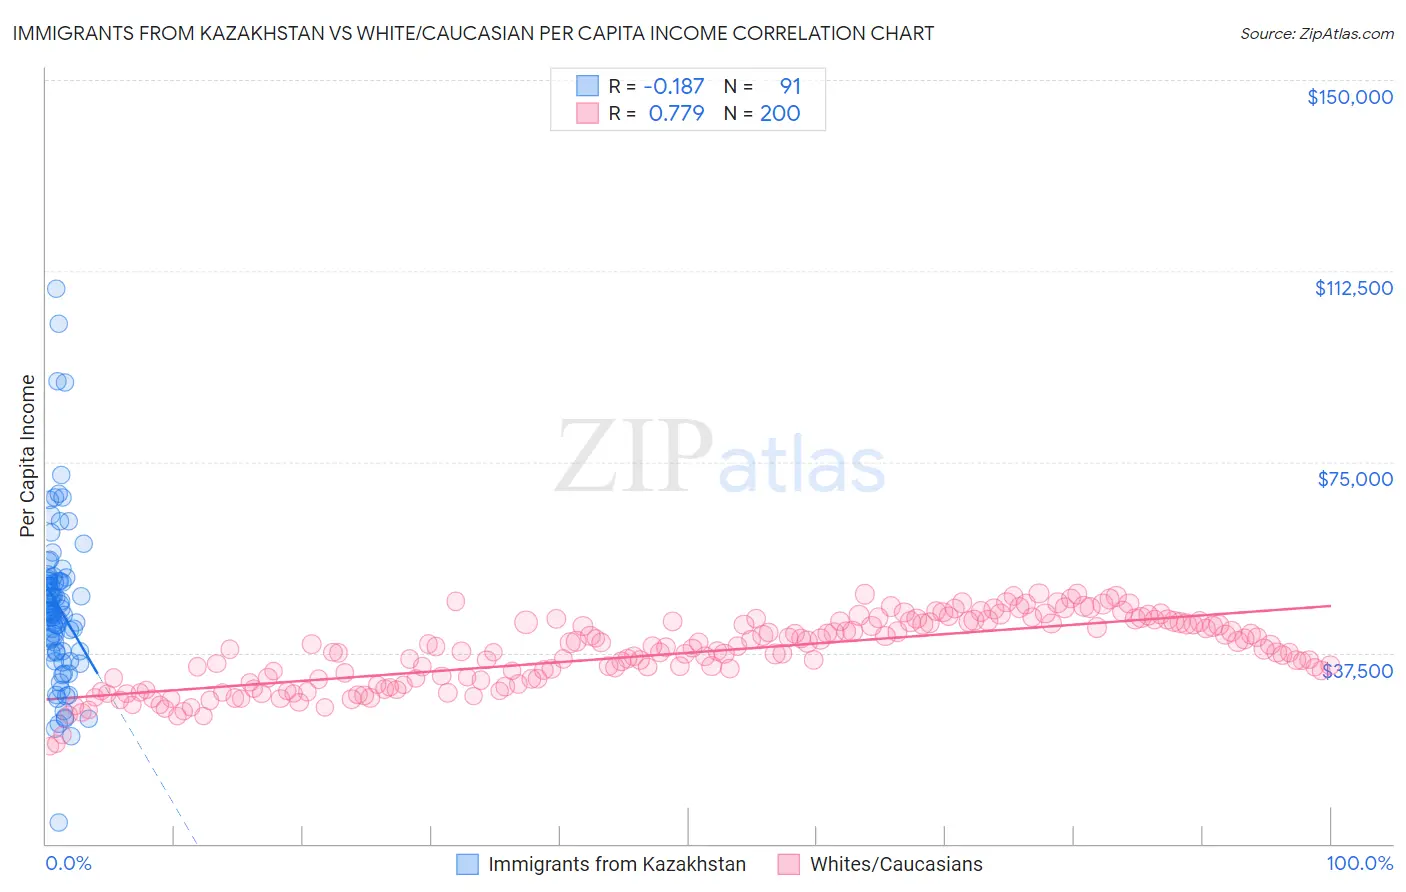
Immigrants from Kazakhstan vs White/Caucasian Per Capita Income Correlation Chart
The statistical analysis conducted on geographies consisting of 124,442,915 people shows a poor negative correlation between the proportion of Immigrants from Kazakhstan and per capita income in the United States with a correlation coefficient (R) of -0.187 and weighted average of $48,747. Similarly, the statistical analysis conducted on geographies consisting of 585,276,990 people shows a strong positive correlation between the proportion of Whites/Caucasians and per capita income in the United States with a correlation coefficient (R) of 0.779 and weighted average of $42,180, a difference of 15.6%.
Per Capita Income Correlation Summary
| Measurement | Immigrants from Kazakhstan | White/Caucasian |
| Minimum | $4,252 | $19,081 |
| Maximum | $109,103 | $49,196 |
| Range | $104,851 | $30,115 |
| Mean | $46,679 | $37,504 |
| Median | $45,620 | $37,771 |
| Interquartile 25% (IQ1) | $37,540 | $31,862 |
| Interquartile 75% (IQ3) | $51,665 | $43,459 |
| Interquartile Range (IQR) | $14,125 | $11,597 |
| Standard Deviation (Sample) | $16,400 | $6,823 |
| Standard Deviation (Population) | $16,310 | $6,806 |
Similar Demographics by Per Capita Income
Demographics Similar to Immigrants from Kazakhstan by Per Capita Income
In terms of per capita income, the demographic groups most similar to Immigrants from Kazakhstan are Immigrants from Italy ($48,654, a difference of 0.19%), Immigrants from England ($48,844, a difference of 0.20%), Immigrants from Bolivia ($48,970, a difference of 0.46%), Romanian ($48,445, a difference of 0.62%), and Egyptian ($48,358, a difference of 0.80%).
| Demographics | Rating | Rank | Per Capita Income |
| Immigrants | Eastern Europe | 99.8 /100 | #70 | Exceptional $49,316 |
| Greeks | 99.8 /100 | #71 | Exceptional $49,309 |
| Immigrants | Hungary | 99.8 /100 | #72 | Exceptional $49,303 |
| Immigrants | North America | 99.8 /100 | #73 | Exceptional $49,302 |
| Mongolians | 99.8 /100 | #74 | Exceptional $49,173 |
| Immigrants | Bolivia | 99.7 /100 | #75 | Exceptional $48,970 |
| Immigrants | England | 99.7 /100 | #76 | Exceptional $48,844 |
| Immigrants | Kazakhstan | 99.7 /100 | #77 | Exceptional $48,747 |
| Immigrants | Italy | 99.6 /100 | #78 | Exceptional $48,654 |
| Romanians | 99.5 /100 | #79 | Exceptional $48,445 |
| Egyptians | 99.5 /100 | #80 | Exceptional $48,358 |
| Armenians | 99.4 /100 | #81 | Exceptional $48,287 |
| Immigrants | Indonesia | 99.4 /100 | #82 | Exceptional $48,195 |
| Immigrants | Brazil | 99.4 /100 | #83 | Exceptional $48,164 |
| Immigrants | Ukraine | 99.3 /100 | #84 | Exceptional $48,134 |
Demographics Similar to Whites/Caucasians by Per Capita Income
In terms of per capita income, the demographic groups most similar to Whites/Caucasians are Ghanaian ($42,164, a difference of 0.040%), Aleut ($42,210, a difference of 0.070%), Spanish ($42,249, a difference of 0.16%), Immigrants from Bosnia and Herzegovina ($42,278, a difference of 0.23%), and Venezuelan ($42,074, a difference of 0.25%).
| Demographics | Rating | Rank | Per Capita Income |
| Immigrants | Portugal | 19.7 /100 | #198 | Poor $42,412 |
| Barbadians | 19.6 /100 | #199 | Poor $42,406 |
| Vietnamese | 19.0 /100 | #200 | Poor $42,368 |
| Immigrants | Thailand | 17.6 /100 | #201 | Poor $42,289 |
| Immigrants | Bosnia and Herzegovina | 17.5 /100 | #202 | Poor $42,278 |
| Spanish | 17.0 /100 | #203 | Poor $42,249 |
| Aleuts | 16.4 /100 | #204 | Poor $42,210 |
| Whites/Caucasians | 15.9 /100 | #205 | Poor $42,180 |
| Ghanaians | 15.7 /100 | #206 | Poor $42,164 |
| Venezuelans | 14.4 /100 | #207 | Poor $42,074 |
| Panamanians | 13.9 /100 | #208 | Poor $42,035 |
| Immigrants | Sudan | 13.2 /100 | #209 | Poor $41,986 |
| Ecuadorians | 12.9 /100 | #210 | Poor $41,958 |
| Immigrants | Panama | 11.6 /100 | #211 | Poor $41,853 |
| Immigrants | Senegal | 11.3 /100 | #212 | Poor $41,830 |