Immigrants from Kazakhstan vs Fijian Householder Income Ages 25 - 44 years
COMPARE
Immigrants from Kazakhstan
Fijian
Householder Income Ages 25 - 44 years
Householder Income Ages 25 - 44 years Comparison
Immigrants from Kazakhstan
Fijians
$101,727
HOUSEHOLDER INCOME AGES 25 - 44 YEARS
98.1/ 100
METRIC RATING
98th/ 347
METRIC RANK
$79,956
HOUSEHOLDER INCOME AGES 25 - 44 YEARS
0.0/ 100
METRIC RATING
310th/ 347
METRIC RANK
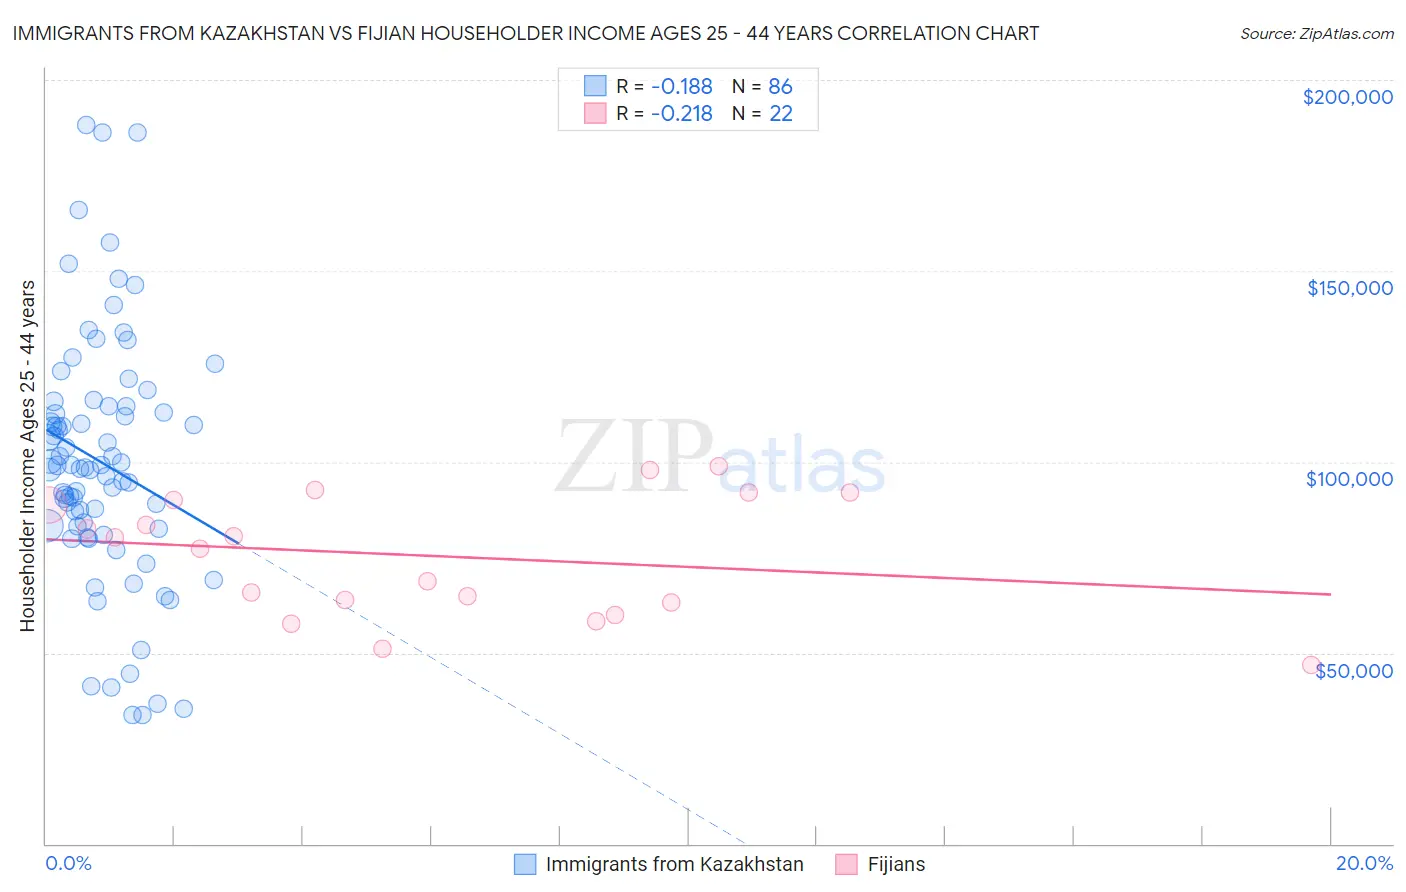
Immigrants from Kazakhstan vs Fijian Householder Income Ages 25 - 44 years Correlation Chart
The statistical analysis conducted on geographies consisting of 124,395,234 people shows a poor negative correlation between the proportion of Immigrants from Kazakhstan and household income with householder between the ages 25 and 44 in the United States with a correlation coefficient (R) of -0.188 and weighted average of $101,727. Similarly, the statistical analysis conducted on geographies consisting of 55,935,087 people shows a weak negative correlation between the proportion of Fijians and household income with householder between the ages 25 and 44 in the United States with a correlation coefficient (R) of -0.218 and weighted average of $79,956, a difference of 27.2%.
Householder Income Ages 25 - 44 years Correlation Summary
| Measurement | Immigrants from Kazakhstan | Fijian |
| Minimum | $33,710 | $46,875 |
| Maximum | $188,234 | $98,958 |
| Range | $154,524 | $52,083 |
| Mean | $99,834 | $75,303 |
| Median | $98,784 | $78,830 |
| Interquartile 25% (IQ1) | $83,191 | $63,125 |
| Interquartile 75% (IQ3) | $114,592 | $89,954 |
| Interquartile Range (IQR) | $31,401 | $26,829 |
| Standard Deviation (Sample) | $32,549 | $15,837 |
| Standard Deviation (Population) | $32,360 | $15,473 |
Similar Demographics by Householder Income Ages 25 - 44 years
Demographics Similar to Immigrants from Kazakhstan by Householder Income Ages 25 - 44 years
In terms of householder income ages 25 - 44 years, the demographic groups most similar to Immigrants from Kazakhstan are Austrian ($101,842, a difference of 0.11%), Macedonian ($101,882, a difference of 0.15%), Assyrian/Chaldean/Syriac ($101,936, a difference of 0.21%), Sri Lankan ($101,960, a difference of 0.23%), and Taiwanese ($101,492, a difference of 0.23%).
| Demographics | Rating | Rank | Householder Income Ages 25 - 44 years |
| Croatians | 98.7 /100 | #91 | Exceptional $102,414 |
| Immigrants | North America | 98.7 /100 | #92 | Exceptional $102,407 |
| Immigrants | England | 98.4 /100 | #93 | Exceptional $102,020 |
| Sri Lankans | 98.4 /100 | #94 | Exceptional $101,960 |
| Assyrians/Chaldeans/Syriacs | 98.3 /100 | #95 | Exceptional $101,936 |
| Macedonians | 98.3 /100 | #96 | Exceptional $101,882 |
| Austrians | 98.3 /100 | #97 | Exceptional $101,842 |
| Immigrants | Kazakhstan | 98.1 /100 | #98 | Exceptional $101,727 |
| Taiwanese | 97.9 /100 | #99 | Exceptional $101,492 |
| Immigrants | Argentina | 97.8 /100 | #100 | Exceptional $101,415 |
| Albanians | 97.8 /100 | #101 | Exceptional $101,367 |
| Immigrants | Lebanon | 97.4 /100 | #102 | Exceptional $101,124 |
| Immigrants | Moldova | 97.4 /100 | #103 | Exceptional $101,091 |
| Immigrants | Poland | 97.4 /100 | #104 | Exceptional $101,065 |
| Immigrants | Vietnam | 96.5 /100 | #105 | Exceptional $100,535 |
Demographics Similar to Fijians by Householder Income Ages 25 - 44 years
In terms of householder income ages 25 - 44 years, the demographic groups most similar to Fijians are Chippewa ($80,005, a difference of 0.060%), Immigrants from Central America ($80,012, a difference of 0.070%), Haitian ($80,055, a difference of 0.12%), Apache ($80,260, a difference of 0.38%), and Immigrants from Dominican Republic ($80,319, a difference of 0.45%).
| Demographics | Rating | Rank | Householder Income Ages 25 - 44 years |
| Mexicans | 0.0 /100 | #303 | Tragic $80,427 |
| Immigrants | Caribbean | 0.0 /100 | #304 | Tragic $80,326 |
| Immigrants | Dominican Republic | 0.0 /100 | #305 | Tragic $80,319 |
| Apache | 0.0 /100 | #306 | Tragic $80,260 |
| Haitians | 0.0 /100 | #307 | Tragic $80,055 |
| Immigrants | Central America | 0.0 /100 | #308 | Tragic $80,012 |
| Chippewa | 0.0 /100 | #309 | Tragic $80,005 |
| Fijians | 0.0 /100 | #310 | Tragic $79,956 |
| Indonesians | 0.0 /100 | #311 | Tragic $79,543 |
| Immigrants | Haiti | 0.0 /100 | #312 | Tragic $79,391 |
| Menominee | 0.0 /100 | #313 | Tragic $79,358 |
| Cheyenne | 0.0 /100 | #314 | Tragic $79,152 |
| Ottawa | 0.0 /100 | #315 | Tragic $79,012 |
| Africans | 0.0 /100 | #316 | Tragic $78,986 |
| U.S. Virgin Islanders | 0.0 /100 | #317 | Tragic $78,911 |