Immigrants from Kazakhstan vs Nigerian Householder Income Ages 25 - 44 years
COMPARE
Immigrants from Kazakhstan
Nigerian
Householder Income Ages 25 - 44 years
Householder Income Ages 25 - 44 years Comparison
Immigrants from Kazakhstan
Nigerians
$101,727
HOUSEHOLDER INCOME AGES 25 - 44 YEARS
98.1/ 100
METRIC RATING
98th/ 347
METRIC RANK
$87,730
HOUSEHOLDER INCOME AGES 25 - 44 YEARS
2.2/ 100
METRIC RATING
241st/ 347
METRIC RANK
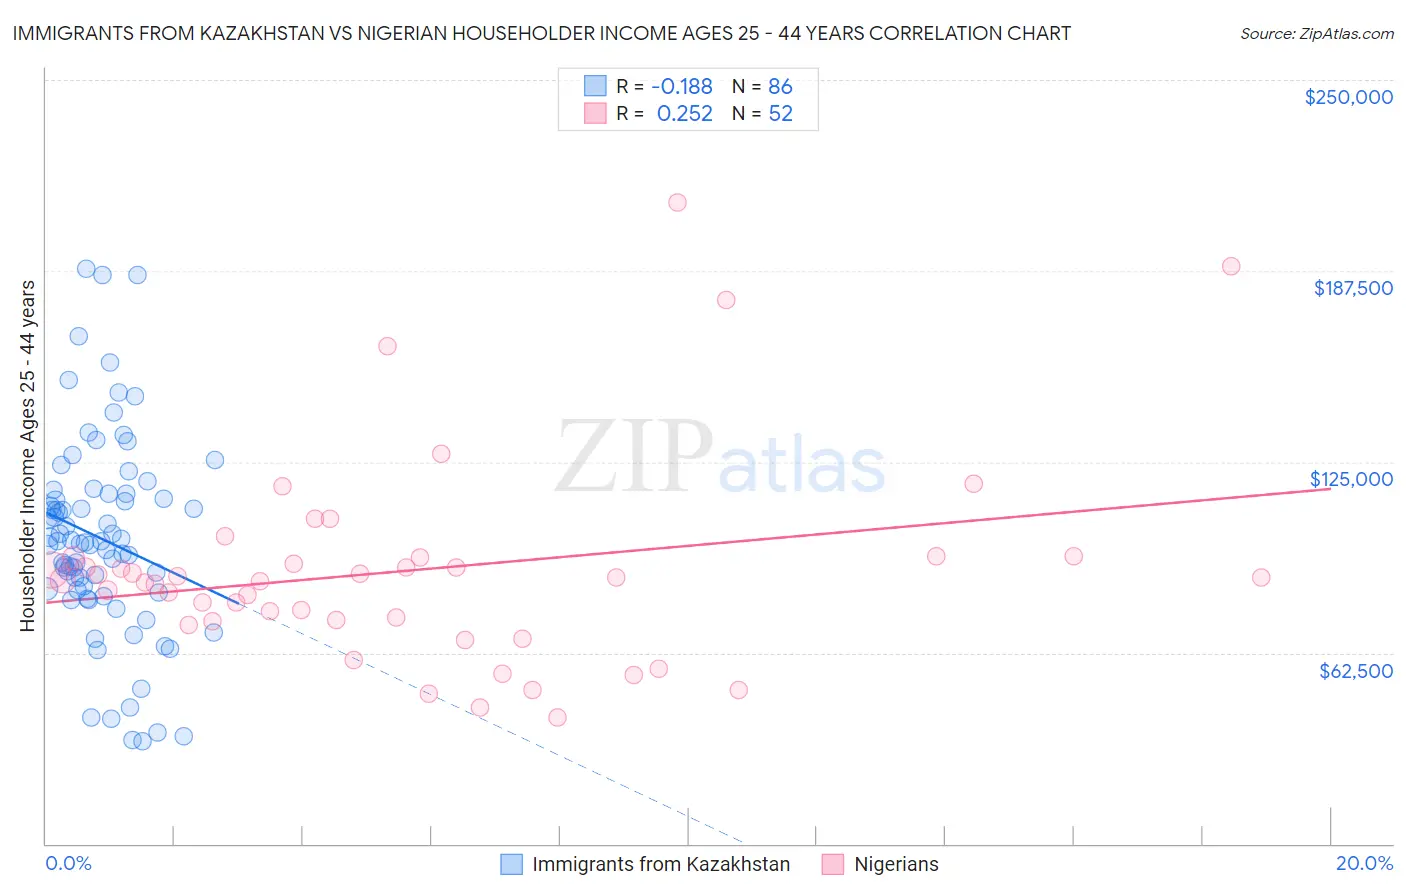
Immigrants from Kazakhstan vs Nigerian Householder Income Ages 25 - 44 years Correlation Chart
The statistical analysis conducted on geographies consisting of 124,395,234 people shows a poor negative correlation between the proportion of Immigrants from Kazakhstan and household income with householder between the ages 25 and 44 in the United States with a correlation coefficient (R) of -0.188 and weighted average of $101,727. Similarly, the statistical analysis conducted on geographies consisting of 332,006,282 people shows a weak positive correlation between the proportion of Nigerians and household income with householder between the ages 25 and 44 in the United States with a correlation coefficient (R) of 0.252 and weighted average of $87,730, a difference of 16.0%.
Householder Income Ages 25 - 44 years Correlation Summary
| Measurement | Immigrants from Kazakhstan | Nigerian |
| Minimum | $33,710 | $41,500 |
| Maximum | $188,234 | $210,089 |
| Range | $154,524 | $168,589 |
| Mean | $99,834 | $89,439 |
| Median | $98,784 | $86,690 |
| Interquartile 25% (IQ1) | $83,191 | $73,174 |
| Interquartile 75% (IQ3) | $114,592 | $93,591 |
| Interquartile Range (IQR) | $31,401 | $20,417 |
| Standard Deviation (Sample) | $32,549 | $33,605 |
| Standard Deviation (Population) | $32,360 | $33,281 |
Similar Demographics by Householder Income Ages 25 - 44 years
Demographics Similar to Immigrants from Kazakhstan by Householder Income Ages 25 - 44 years
In terms of householder income ages 25 - 44 years, the demographic groups most similar to Immigrants from Kazakhstan are Austrian ($101,842, a difference of 0.11%), Macedonian ($101,882, a difference of 0.15%), Assyrian/Chaldean/Syriac ($101,936, a difference of 0.21%), Sri Lankan ($101,960, a difference of 0.23%), and Taiwanese ($101,492, a difference of 0.23%).
| Demographics | Rating | Rank | Householder Income Ages 25 - 44 years |
| Croatians | 98.7 /100 | #91 | Exceptional $102,414 |
| Immigrants | North America | 98.7 /100 | #92 | Exceptional $102,407 |
| Immigrants | England | 98.4 /100 | #93 | Exceptional $102,020 |
| Sri Lankans | 98.4 /100 | #94 | Exceptional $101,960 |
| Assyrians/Chaldeans/Syriacs | 98.3 /100 | #95 | Exceptional $101,936 |
| Macedonians | 98.3 /100 | #96 | Exceptional $101,882 |
| Austrians | 98.3 /100 | #97 | Exceptional $101,842 |
| Immigrants | Kazakhstan | 98.1 /100 | #98 | Exceptional $101,727 |
| Taiwanese | 97.9 /100 | #99 | Exceptional $101,492 |
| Immigrants | Argentina | 97.8 /100 | #100 | Exceptional $101,415 |
| Albanians | 97.8 /100 | #101 | Exceptional $101,367 |
| Immigrants | Lebanon | 97.4 /100 | #102 | Exceptional $101,124 |
| Immigrants | Moldova | 97.4 /100 | #103 | Exceptional $101,091 |
| Immigrants | Poland | 97.4 /100 | #104 | Exceptional $101,065 |
| Immigrants | Vietnam | 96.5 /100 | #105 | Exceptional $100,535 |
Demographics Similar to Nigerians by Householder Income Ages 25 - 44 years
In terms of householder income ages 25 - 44 years, the demographic groups most similar to Nigerians are Nicaraguan ($87,751, a difference of 0.020%), Immigrants from Ghana ($87,760, a difference of 0.030%), Alaska Native ($88,018, a difference of 0.33%), Salvadoran ($88,198, a difference of 0.53%), and Immigrants from Cameroon ($88,214, a difference of 0.55%).
| Demographics | Rating | Rank | Householder Income Ages 25 - 44 years |
| Venezuelans | 2.9 /100 | #234 | Tragic $88,232 |
| Bermudans | 2.9 /100 | #235 | Tragic $88,231 |
| Immigrants | Cameroon | 2.9 /100 | #236 | Tragic $88,214 |
| Salvadorans | 2.8 /100 | #237 | Tragic $88,198 |
| Alaska Natives | 2.6 /100 | #238 | Tragic $88,018 |
| Immigrants | Ghana | 2.2 /100 | #239 | Tragic $87,760 |
| Nicaraguans | 2.2 /100 | #240 | Tragic $87,751 |
| Nigerians | 2.2 /100 | #241 | Tragic $87,730 |
| West Indians | 1.7 /100 | #242 | Tragic $87,205 |
| Immigrants | West Indies | 1.5 /100 | #243 | Tragic $87,063 |
| Immigrants | Venezuela | 1.5 /100 | #244 | Tragic $87,038 |
| Immigrants | El Salvador | 1.4 /100 | #245 | Tragic $86,913 |
| Immigrants | Burma/Myanmar | 1.3 /100 | #246 | Tragic $86,736 |
| Immigrants | Nigeria | 1.2 /100 | #247 | Tragic $86,589 |
| Immigrants | Sudan | 0.9 /100 | #248 | Tragic $86,109 |