Immigrants from Kazakhstan vs Immigrants from Venezuela In Labor Force | Age 25-29
COMPARE
Immigrants from Kazakhstan
Immigrants from Venezuela
In Labor Force | Age 25-29
In Labor Force | Age 25-29 Comparison
Immigrants from Kazakhstan
Immigrants from Venezuela
84.4%
IN LABOR FORCE | AGE 25-29
17.5/ 100
METRIC RATING
200th/ 347
METRIC RANK
84.3%
IN LABOR FORCE | AGE 25-29
12.6/ 100
METRIC RATING
211th/ 347
METRIC RANK
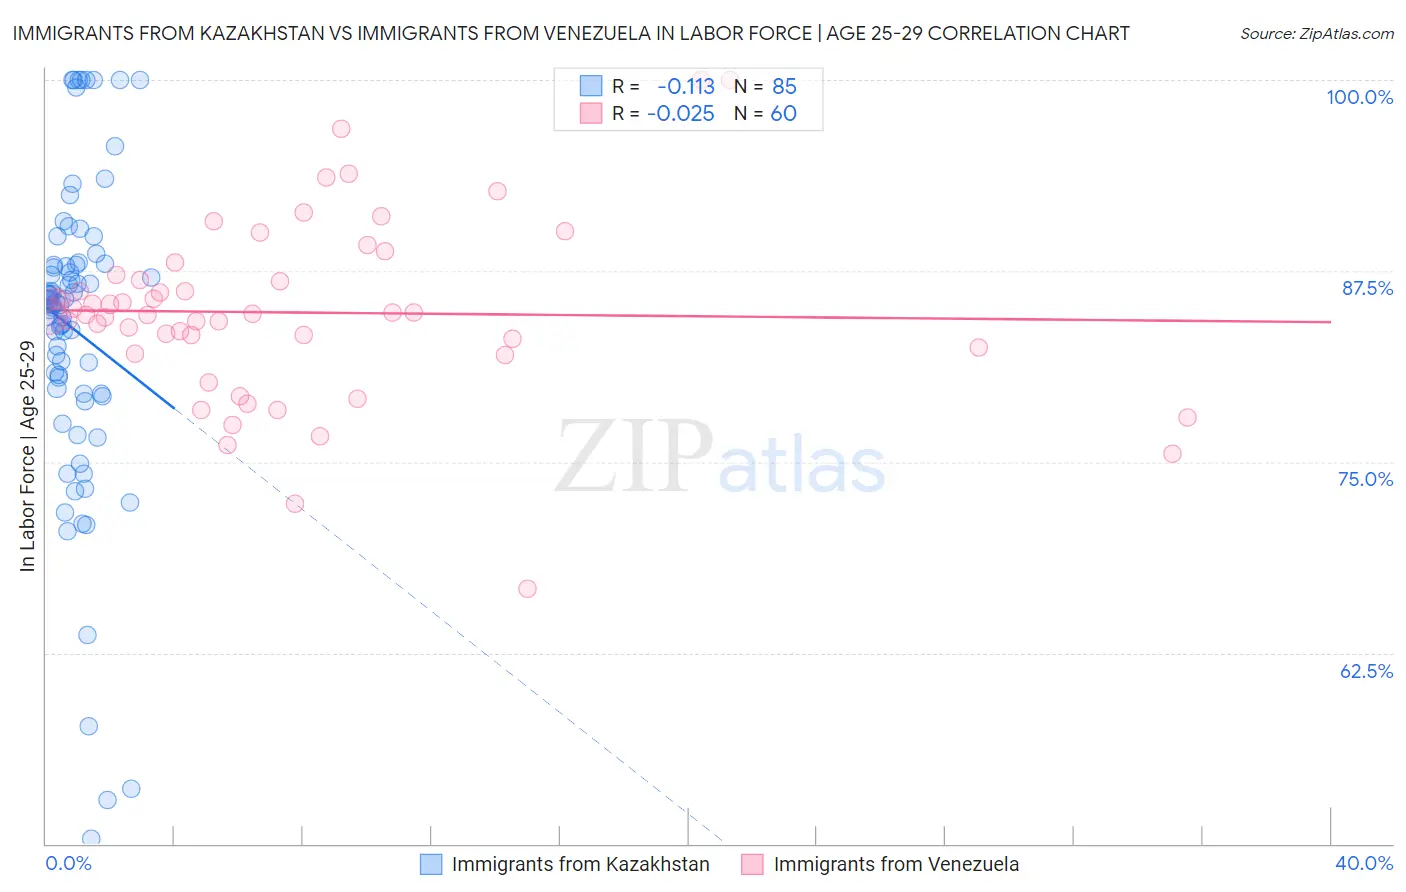
Immigrants from Kazakhstan vs Immigrants from Venezuela In Labor Force | Age 25-29 Correlation Chart
The statistical analysis conducted on geographies consisting of 124,427,458 people shows a poor negative correlation between the proportion of Immigrants from Kazakhstan and labor force participation rate among population between the ages 25 and 29 in the United States with a correlation coefficient (R) of -0.113 and weighted average of 84.4%. Similarly, the statistical analysis conducted on geographies consisting of 287,835,027 people shows no correlation between the proportion of Immigrants from Venezuela and labor force participation rate among population between the ages 25 and 29 in the United States with a correlation coefficient (R) of -0.025 and weighted average of 84.3%, a difference of 0.070%.
In Labor Force | Age 25-29 Correlation Summary
| Measurement | Immigrants from Kazakhstan | Immigrants from Venezuela |
| Minimum | 50.3% | 66.7% |
| Maximum | 100.0% | 100.0% |
| Range | 49.7% | 33.3% |
| Mean | 83.6% | 84.8% |
| Median | 85.5% | 84.7% |
| Interquartile 25% (IQ1) | 79.5% | 82.3% |
| Interquartile 75% (IQ3) | 88.0% | 87.1% |
| Interquartile Range (IQR) | 8.5% | 4.8% |
| Standard Deviation (Sample) | 10.3% | 6.0% |
| Standard Deviation (Population) | 10.2% | 5.9% |
Demographics Similar to Immigrants from Kazakhstan and Immigrants from Venezuela by In Labor Force | Age 25-29
In terms of in labor force | age 25-29, the demographic groups most similar to Immigrants from Kazakhstan are Immigrants from Germany (84.4%, a difference of 0.010%), Laotian (84.4%, a difference of 0.010%), Tlingit-Haida (84.4%, a difference of 0.020%), Immigrants from Iraq (84.4%, a difference of 0.020%), and Afghan (84.4%, a difference of 0.020%). Similarly, the demographic groups most similar to Immigrants from Venezuela are Immigrants from Jordan (84.4%, a difference of 0.0%), Chinese (84.3%, a difference of 0.0%), Immigrants from Armenia (84.4%, a difference of 0.010%), Immigrants from Indonesia (84.4%, a difference of 0.010%), and Subsaharan African (84.3%, a difference of 0.020%).
| Demographics | Rating | Rank | In Labor Force | Age 25-29 |
| Immigrants | Israel | 20.8 /100 | #195 | Fair 84.4% |
| Immigrants | South Eastern Asia | 19.5 /100 | #196 | Poor 84.4% |
| Tlingit-Haida | 19.3 /100 | #197 | Poor 84.4% |
| Immigrants | Iraq | 19.0 /100 | #198 | Poor 84.4% |
| Immigrants | Germany | 18.3 /100 | #199 | Poor 84.4% |
| Immigrants | Kazakhstan | 17.5 /100 | #200 | Poor 84.4% |
| Laotians | 16.6 /100 | #201 | Poor 84.4% |
| Afghans | 15.9 /100 | #202 | Poor 84.4% |
| Immigrants | Afghanistan | 15.6 /100 | #203 | Poor 84.4% |
| Venezuelans | 15.1 /100 | #204 | Poor 84.4% |
| Ecuadorians | 14.8 /100 | #205 | Poor 84.4% |
| Immigrants | Cambodia | 14.3 /100 | #206 | Poor 84.4% |
| Immigrants | Armenia | 13.3 /100 | #207 | Poor 84.4% |
| Immigrants | Indonesia | 13.2 /100 | #208 | Poor 84.4% |
| Immigrants | Jordan | 12.8 /100 | #209 | Poor 84.4% |
| Chinese | 12.7 /100 | #210 | Poor 84.3% |
| Immigrants | Venezuela | 12.6 /100 | #211 | Poor 84.3% |
| Sub-Saharan Africans | 11.7 /100 | #212 | Poor 84.3% |
| Japanese | 11.4 /100 | #213 | Poor 84.3% |
| Lebanese | 11.1 /100 | #214 | Poor 84.3% |
| Immigrants | Syria | 10.7 /100 | #215 | Poor 84.3% |