Bahamian vs Immigrants from Northern Africa Householder Income Ages 25 - 44 years
COMPARE
Bahamian
Immigrants from Northern Africa
Householder Income Ages 25 - 44 years
Householder Income Ages 25 - 44 years Comparison
Bahamians
Immigrants from Northern Africa
$75,395
HOUSEHOLDER INCOME AGES 25 - 44 YEARS
0.0/ 100
METRIC RATING
332nd/ 347
METRIC RANK
$99,232
HOUSEHOLDER INCOME AGES 25 - 44 YEARS
93.0/ 100
METRIC RATING
117th/ 347
METRIC RANK
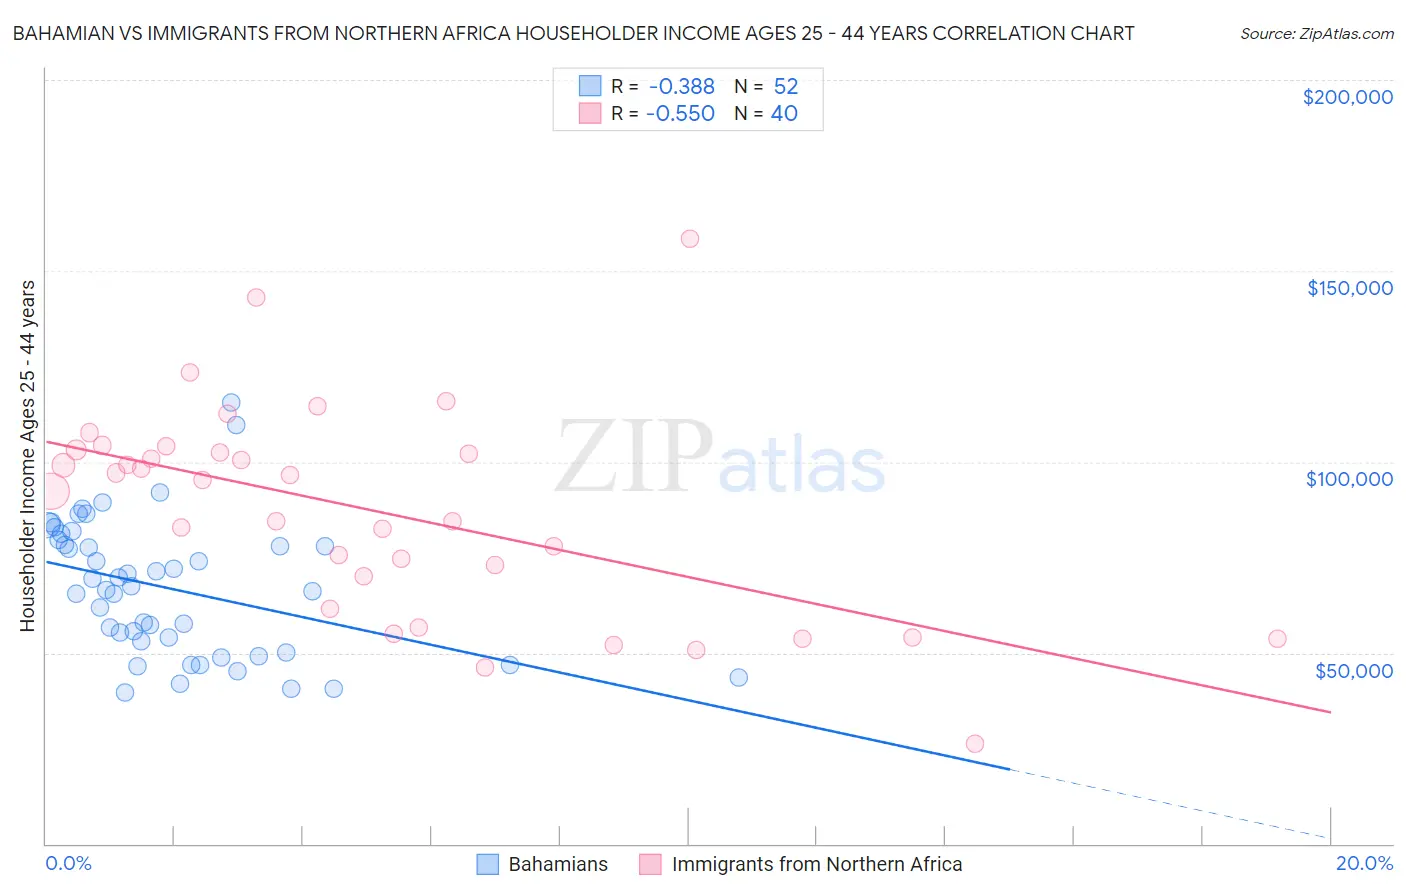
Bahamian vs Immigrants from Northern Africa Householder Income Ages 25 - 44 years Correlation Chart
The statistical analysis conducted on geographies consisting of 112,379,303 people shows a mild negative correlation between the proportion of Bahamians and household income with householder between the ages 25 and 44 in the United States with a correlation coefficient (R) of -0.388 and weighted average of $75,395. Similarly, the statistical analysis conducted on geographies consisting of 320,605,097 people shows a substantial negative correlation between the proportion of Immigrants from Northern Africa and household income with householder between the ages 25 and 44 in the United States with a correlation coefficient (R) of -0.550 and weighted average of $99,232, a difference of 31.6%.
Householder Income Ages 25 - 44 years Correlation Summary
| Measurement | Bahamian | Immigrants from Northern Africa |
| Minimum | $39,485 | $26,250 |
| Maximum | $115,565 | $158,487 |
| Range | $76,080 | $132,237 |
| Mean | $66,851 | $87,149 |
| Median | $66,950 | $93,767 |
| Interquartile 25% (IQ1) | $51,594 | $65,886 |
| Interquartile 75% (IQ3) | $78,952 | $102,671 |
| Interquartile Range (IQR) | $27,358 | $36,785 |
| Standard Deviation (Sample) | $17,732 | $27,415 |
| Standard Deviation (Population) | $17,561 | $27,070 |
Similar Demographics by Householder Income Ages 25 - 44 years
Demographics Similar to Bahamians by Householder Income Ages 25 - 44 years
In terms of householder income ages 25 - 44 years, the demographic groups most similar to Bahamians are Native/Alaskan ($75,647, a difference of 0.34%), Hopi ($75,002, a difference of 0.52%), Creek ($74,847, a difference of 0.73%), Kiowa ($74,776, a difference of 0.83%), and Yakama ($76,226, a difference of 1.1%).
| Demographics | Rating | Rank | Householder Income Ages 25 - 44 years |
| Sioux | 0.0 /100 | #325 | Tragic $77,089 |
| Houma | 0.0 /100 | #326 | Tragic $77,044 |
| Immigrants | Bahamas | 0.0 /100 | #327 | Tragic $76,910 |
| Immigrants | Cuba | 0.0 /100 | #328 | Tragic $76,701 |
| Seminole | 0.0 /100 | #329 | Tragic $76,584 |
| Yakama | 0.0 /100 | #330 | Tragic $76,226 |
| Natives/Alaskans | 0.0 /100 | #331 | Tragic $75,647 |
| Bahamians | 0.0 /100 | #332 | Tragic $75,395 |
| Hopi | 0.0 /100 | #333 | Tragic $75,002 |
| Creek | 0.0 /100 | #334 | Tragic $74,847 |
| Kiowa | 0.0 /100 | #335 | Tragic $74,776 |
| Yup'ik | 0.0 /100 | #336 | Tragic $73,688 |
| Blacks/African Americans | 0.0 /100 | #337 | Tragic $73,370 |
| Immigrants | Yemen | 0.0 /100 | #338 | Tragic $73,043 |
| Yuman | 0.0 /100 | #339 | Tragic $72,956 |
Demographics Similar to Immigrants from Northern Africa by Householder Income Ages 25 - 44 years
In terms of householder income ages 25 - 44 years, the demographic groups most similar to Immigrants from Northern Africa are Syrian ($99,215, a difference of 0.020%), Jordanian ($99,186, a difference of 0.050%), Swedish ($99,136, a difference of 0.10%), Portuguese ($99,429, a difference of 0.20%), and Carpatho Rusyn ($99,449, a difference of 0.22%).
| Demographics | Rating | Rank | Householder Income Ages 25 - 44 years |
| Immigrants | Afghanistan | 95.3 /100 | #110 | Exceptional $99,977 |
| Chileans | 95.1 /100 | #111 | Exceptional $99,900 |
| Poles | 94.5 /100 | #112 | Exceptional $99,685 |
| Tongans | 94.2 /100 | #113 | Exceptional $99,604 |
| Immigrants | Western Asia | 94.0 /100 | #114 | Exceptional $99,516 |
| Carpatho Rusyns | 93.7 /100 | #115 | Exceptional $99,449 |
| Portuguese | 93.7 /100 | #116 | Exceptional $99,429 |
| Immigrants | Northern Africa | 93.0 /100 | #117 | Exceptional $99,232 |
| Syrians | 92.9 /100 | #118 | Exceptional $99,215 |
| Jordanians | 92.8 /100 | #119 | Exceptional $99,186 |
| Swedes | 92.7 /100 | #120 | Exceptional $99,136 |
| Peruvians | 91.7 /100 | #121 | Exceptional $98,886 |
| Immigrants | Uzbekistan | 91.5 /100 | #122 | Exceptional $98,849 |
| Palestinians | 91.2 /100 | #123 | Exceptional $98,777 |
| Zimbabweans | 90.3 /100 | #124 | Exceptional $98,586 |