Immigrants from Japan vs Dutch West Indian Median Female Earnings
COMPARE
Immigrants from Japan
Dutch West Indian
Median Female Earnings
Median Female Earnings Comparison
Immigrants from Japan
Dutch West Indians
$45,323
MEDIAN FEMALE EARNINGS
100.0/ 100
METRIC RATING
20th/ 347
METRIC RANK
$34,106
MEDIAN FEMALE EARNINGS
0.0/ 100
METRIC RATING
325th/ 347
METRIC RANK
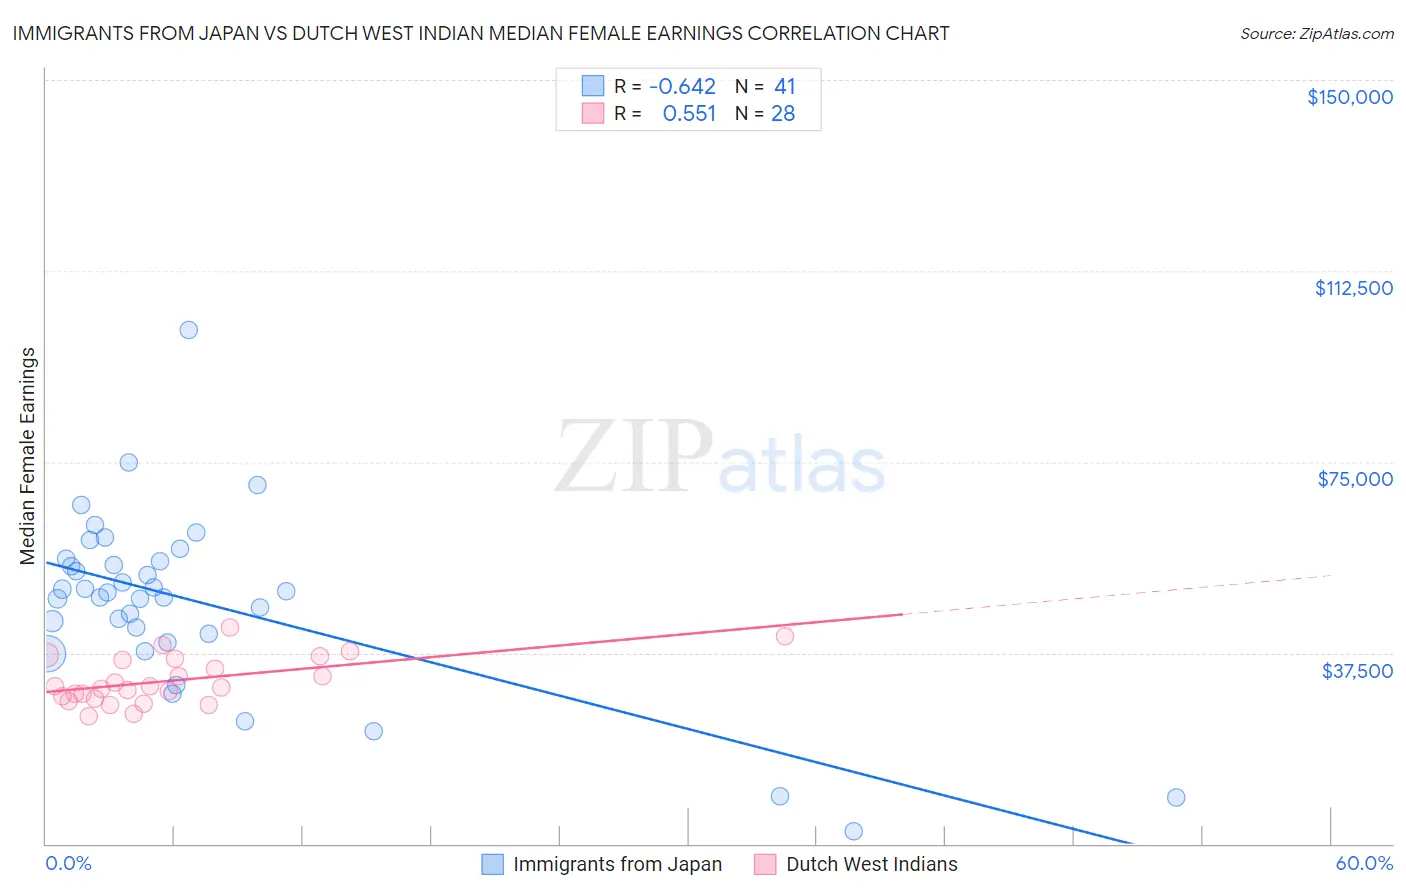
Immigrants from Japan vs Dutch West Indian Median Female Earnings Correlation Chart
The statistical analysis conducted on geographies consisting of 340,067,986 people shows a significant negative correlation between the proportion of Immigrants from Japan and median female earnings in the United States with a correlation coefficient (R) of -0.642 and weighted average of $45,323. Similarly, the statistical analysis conducted on geographies consisting of 85,733,523 people shows a substantial positive correlation between the proportion of Dutch West Indians and median female earnings in the United States with a correlation coefficient (R) of 0.551 and weighted average of $34,106, a difference of 32.9%.
Median Female Earnings Correlation Summary
| Measurement | Immigrants from Japan | Dutch West Indian |
| Minimum | $2,499 | $25,030 |
| Maximum | $100,821 | $42,538 |
| Range | $98,322 | $17,508 |
| Mean | $47,310 | $32,091 |
| Median | $49,462 | $30,746 |
| Interquartile 25% (IQ1) | $40,316 | $28,657 |
| Interquartile 75% (IQ3) | $55,693 | $36,289 |
| Interquartile Range (IQR) | $15,376 | $7,632 |
| Standard Deviation (Sample) | $17,852 | $4,662 |
| Standard Deviation (Population) | $17,633 | $4,578 |
Similar Demographics by Median Female Earnings
Demographics Similar to Immigrants from Japan by Median Female Earnings
In terms of median female earnings, the demographic groups most similar to Immigrants from Japan are Eastern European ($45,385, a difference of 0.14%), Cypriot ($45,570, a difference of 0.55%), Cambodian ($45,014, a difference of 0.69%), Immigrants from Greece ($44,976, a difference of 0.77%), and Burmese ($44,911, a difference of 0.92%).
| Demographics | Rating | Rank | Median Female Earnings |
| Immigrants | Australia | 100.0 /100 | #13 | Exceptional $46,573 |
| Soviet Union | 100.0 /100 | #14 | Exceptional $46,556 |
| Immigrants | Eastern Asia | 100.0 /100 | #15 | Exceptional $46,502 |
| Indians (Asian) | 100.0 /100 | #16 | Exceptional $46,481 |
| Immigrants | South Central Asia | 100.0 /100 | #17 | Exceptional $46,324 |
| Cypriots | 100.0 /100 | #18 | Exceptional $45,570 |
| Eastern Europeans | 100.0 /100 | #19 | Exceptional $45,385 |
| Immigrants | Japan | 100.0 /100 | #20 | Exceptional $45,323 |
| Cambodians | 100.0 /100 | #21 | Exceptional $45,014 |
| Immigrants | Greece | 100.0 /100 | #22 | Exceptional $44,976 |
| Burmese | 100.0 /100 | #23 | Exceptional $44,911 |
| Immigrants | Korea | 100.0 /100 | #24 | Exceptional $44,847 |
| Immigrants | Sweden | 100.0 /100 | #25 | Exceptional $44,774 |
| Immigrants | Belarus | 100.0 /100 | #26 | Exceptional $44,757 |
| Turks | 100.0 /100 | #27 | Exceptional $44,695 |
Demographics Similar to Dutch West Indians by Median Female Earnings
In terms of median female earnings, the demographic groups most similar to Dutch West Indians are Kiowa ($34,074, a difference of 0.090%), Cajun ($34,034, a difference of 0.21%), Immigrants from Central America ($33,953, a difference of 0.45%), Hopi ($33,932, a difference of 0.51%), and Immigrants from Congo ($34,317, a difference of 0.62%).
| Demographics | Rating | Rank | Median Female Earnings |
| Immigrants | Yemen | 0.0 /100 | #318 | Tragic $34,693 |
| Shoshone | 0.0 /100 | #319 | Tragic $34,677 |
| Immigrants | Honduras | 0.0 /100 | #320 | Tragic $34,647 |
| Hispanics or Latinos | 0.0 /100 | #321 | Tragic $34,421 |
| Chickasaw | 0.0 /100 | #322 | Tragic $34,414 |
| Seminole | 0.0 /100 | #323 | Tragic $34,385 |
| Immigrants | Congo | 0.0 /100 | #324 | Tragic $34,317 |
| Dutch West Indians | 0.0 /100 | #325 | Tragic $34,106 |
| Kiowa | 0.0 /100 | #326 | Tragic $34,074 |
| Cajuns | 0.0 /100 | #327 | Tragic $34,034 |
| Immigrants | Central America | 0.0 /100 | #328 | Tragic $33,953 |
| Hopi | 0.0 /100 | #329 | Tragic $33,932 |
| Menominee | 0.0 /100 | #330 | Tragic $33,894 |
| Natives/Alaskans | 0.0 /100 | #331 | Tragic $33,806 |
| Choctaw | 0.0 /100 | #332 | Tragic $33,775 |