Immigrants from Japan vs Armenian Median Earnings
COMPARE
Immigrants from Japan
Armenian
Median Earnings
Median Earnings Comparison
Immigrants from Japan
Armenians
$54,938
MEDIAN EARNINGS
100.0/ 100
METRIC RATING
18th/ 347
METRIC RANK
$49,804
MEDIAN EARNINGS
99.1/ 100
METRIC RATING
93rd/ 347
METRIC RANK
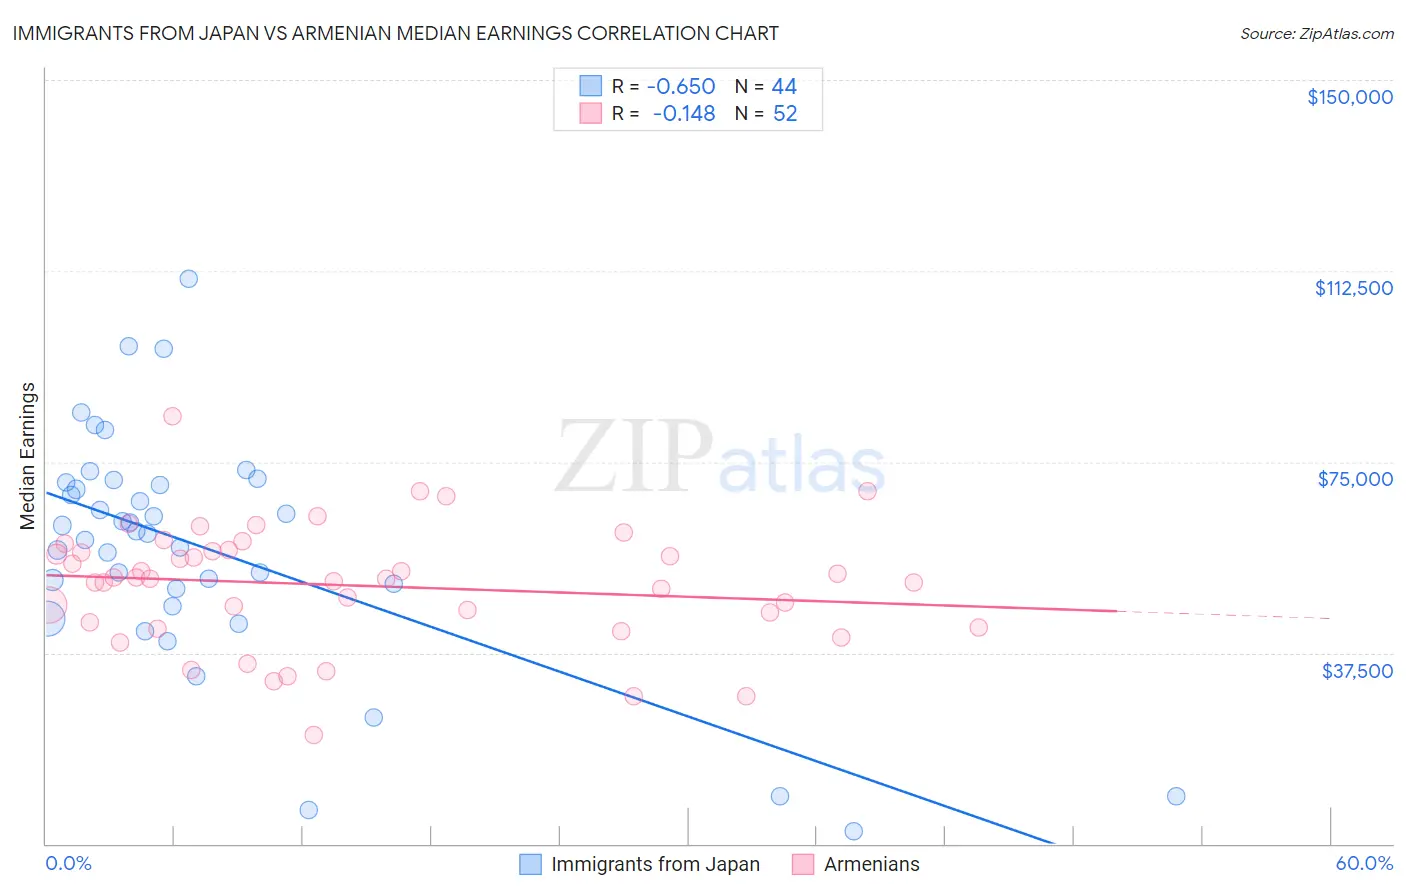
Immigrants from Japan vs Armenian Median Earnings Correlation Chart
The statistical analysis conducted on geographies consisting of 340,132,421 people shows a significant negative correlation between the proportion of Immigrants from Japan and median earnings in the United States with a correlation coefficient (R) of -0.650 and weighted average of $54,938. Similarly, the statistical analysis conducted on geographies consisting of 310,945,861 people shows a poor negative correlation between the proportion of Armenians and median earnings in the United States with a correlation coefficient (R) of -0.148 and weighted average of $49,804, a difference of 10.3%.
Median Earnings Correlation Summary
| Measurement | Immigrants from Japan | Armenian |
| Minimum | $2,499 | $21,250 |
| Maximum | $110,893 | $84,019 |
| Range | $108,394 | $62,769 |
| Mean | $57,767 | $50,725 |
| Median | $61,115 | $52,028 |
| Interquartile 25% (IQ1) | $48,389 | $43,022 |
| Interquartile 75% (IQ3) | $70,647 | $57,580 |
| Interquartile Range (IQR) | $22,258 | $14,558 |
| Standard Deviation (Sample) | $23,135 | $11,922 |
| Standard Deviation (Population) | $22,870 | $11,807 |
Similar Demographics by Median Earnings
Demographics Similar to Immigrants from Japan by Median Earnings
In terms of median earnings, the demographic groups most similar to Immigrants from Japan are Eastern European ($55,084, a difference of 0.26%), Immigrants from Belgium ($54,679, a difference of 0.47%), Cypriot ($54,589, a difference of 0.64%), Burmese ($54,559, a difference of 0.69%), and Immigrants from Korea ($54,530, a difference of 0.75%).
| Demographics | Rating | Rank | Median Earnings |
| Immigrants | Israel | 100.0 /100 | #11 | Exceptional $57,034 |
| Immigrants | Ireland | 100.0 /100 | #12 | Exceptional $56,854 |
| Immigrants | China | 100.0 /100 | #13 | Exceptional $56,638 |
| Immigrants | Australia | 100.0 /100 | #14 | Exceptional $56,305 |
| Indians (Asian) | 100.0 /100 | #15 | Exceptional $56,253 |
| Immigrants | Eastern Asia | 100.0 /100 | #16 | Exceptional $56,183 |
| Eastern Europeans | 100.0 /100 | #17 | Exceptional $55,084 |
| Immigrants | Japan | 100.0 /100 | #18 | Exceptional $54,938 |
| Immigrants | Belgium | 100.0 /100 | #19 | Exceptional $54,679 |
| Cypriots | 100.0 /100 | #20 | Exceptional $54,589 |
| Burmese | 100.0 /100 | #21 | Exceptional $54,559 |
| Immigrants | Korea | 100.0 /100 | #22 | Exceptional $54,530 |
| Immigrants | Sweden | 100.0 /100 | #23 | Exceptional $54,478 |
| Soviet Union | 100.0 /100 | #24 | Exceptional $54,290 |
| Turks | 100.0 /100 | #25 | Exceptional $53,919 |
Demographics Similar to Armenians by Median Earnings
In terms of median earnings, the demographic groups most similar to Armenians are Immigrants from Argentina ($49,841, a difference of 0.070%), Croatian ($49,724, a difference of 0.16%), Immigrants from England ($49,722, a difference of 0.16%), Macedonian ($49,893, a difference of 0.18%), and Italian ($49,915, a difference of 0.22%).
| Demographics | Rating | Rank | Median Earnings |
| Immigrants | Canada | 99.5 /100 | #86 | Exceptional $50,192 |
| Immigrants | Uzbekistan | 99.5 /100 | #87 | Exceptional $50,151 |
| Albanians | 99.4 /100 | #88 | Exceptional $50,116 |
| Immigrants | North America | 99.4 /100 | #89 | Exceptional $50,108 |
| Italians | 99.3 /100 | #90 | Exceptional $49,915 |
| Macedonians | 99.2 /100 | #91 | Exceptional $49,893 |
| Immigrants | Argentina | 99.2 /100 | #92 | Exceptional $49,841 |
| Armenians | 99.1 /100 | #93 | Exceptional $49,804 |
| Croatians | 99.0 /100 | #94 | Exceptional $49,724 |
| Immigrants | England | 99.0 /100 | #95 | Exceptional $49,722 |
| Immigrants | Lebanon | 99.0 /100 | #96 | Exceptional $49,682 |
| Immigrants | North Macedonia | 98.9 /100 | #97 | Exceptional $49,658 |
| Immigrants | Northern Africa | 98.9 /100 | #98 | Exceptional $49,648 |
| Immigrants | Afghanistan | 98.9 /100 | #99 | Exceptional $49,645 |
| Immigrants | Poland | 98.9 /100 | #100 | Exceptional $49,633 |