Immigrants from Japan vs Belgian Median Earnings
COMPARE
Immigrants from Japan
Belgian
Median Earnings
Median Earnings Comparison
Immigrants from Japan
Belgians
$54,938
MEDIAN EARNINGS
100.0/ 100
METRIC RATING
18th/ 347
METRIC RANK
$46,375
MEDIAN EARNINGS
48.0/ 100
METRIC RATING
177th/ 347
METRIC RANK
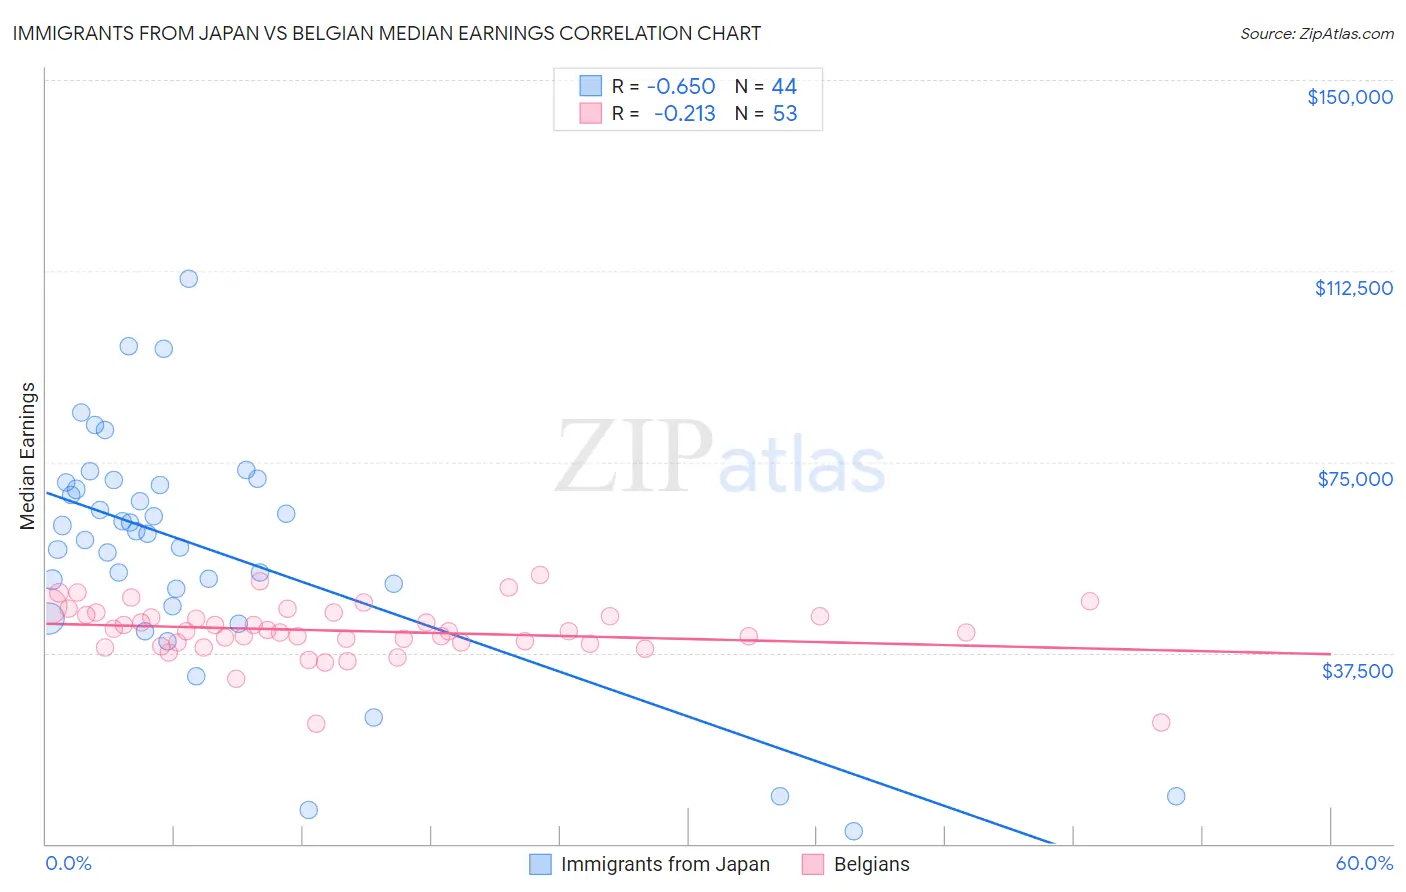
Immigrants from Japan vs Belgian Median Earnings Correlation Chart
The statistical analysis conducted on geographies consisting of 340,132,421 people shows a significant negative correlation between the proportion of Immigrants from Japan and median earnings in the United States with a correlation coefficient (R) of -0.650 and weighted average of $54,938. Similarly, the statistical analysis conducted on geographies consisting of 356,004,504 people shows a weak negative correlation between the proportion of Belgians and median earnings in the United States with a correlation coefficient (R) of -0.213 and weighted average of $46,375, a difference of 18.5%.
Median Earnings Correlation Summary
| Measurement | Immigrants from Japan | Belgian |
| Minimum | $2,499 | $23,500 |
| Maximum | $110,893 | $52,848 |
| Range | $108,394 | $29,348 |
| Mean | $57,767 | $41,793 |
| Median | $61,115 | $41,635 |
| Interquartile 25% (IQ1) | $48,389 | $39,329 |
| Interquartile 75% (IQ3) | $70,647 | $45,075 |
| Interquartile Range (IQR) | $22,258 | $5,747 |
| Standard Deviation (Sample) | $23,135 | $5,579 |
| Standard Deviation (Population) | $22,870 | $5,526 |
Similar Demographics by Median Earnings
Demographics Similar to Immigrants from Japan by Median Earnings
In terms of median earnings, the demographic groups most similar to Immigrants from Japan are Eastern European ($55,084, a difference of 0.26%), Immigrants from Belgium ($54,679, a difference of 0.47%), Cypriot ($54,589, a difference of 0.64%), Burmese ($54,559, a difference of 0.69%), and Immigrants from Korea ($54,530, a difference of 0.75%).
| Demographics | Rating | Rank | Median Earnings |
| Immigrants | Israel | 100.0 /100 | #11 | Exceptional $57,034 |
| Immigrants | Ireland | 100.0 /100 | #12 | Exceptional $56,854 |
| Immigrants | China | 100.0 /100 | #13 | Exceptional $56,638 |
| Immigrants | Australia | 100.0 /100 | #14 | Exceptional $56,305 |
| Indians (Asian) | 100.0 /100 | #15 | Exceptional $56,253 |
| Immigrants | Eastern Asia | 100.0 /100 | #16 | Exceptional $56,183 |
| Eastern Europeans | 100.0 /100 | #17 | Exceptional $55,084 |
| Immigrants | Japan | 100.0 /100 | #18 | Exceptional $54,938 |
| Immigrants | Belgium | 100.0 /100 | #19 | Exceptional $54,679 |
| Cypriots | 100.0 /100 | #20 | Exceptional $54,589 |
| Burmese | 100.0 /100 | #21 | Exceptional $54,559 |
| Immigrants | Korea | 100.0 /100 | #22 | Exceptional $54,530 |
| Immigrants | Sweden | 100.0 /100 | #23 | Exceptional $54,478 |
| Soviet Union | 100.0 /100 | #24 | Exceptional $54,290 |
| Turks | 100.0 /100 | #25 | Exceptional $53,919 |
Demographics Similar to Belgians by Median Earnings
In terms of median earnings, the demographic groups most similar to Belgians are Danish ($46,392, a difference of 0.040%), Basque ($46,399, a difference of 0.050%), Colombian ($46,349, a difference of 0.060%), English ($46,334, a difference of 0.090%), and Puget Sound Salish ($46,333, a difference of 0.090%).
| Demographics | Rating | Rank | Median Earnings |
| Immigrants | Immigrants | 51.6 /100 | #170 | Average $46,478 |
| Scottish | 51.1 /100 | #171 | Average $46,463 |
| Kenyans | 51.0 /100 | #172 | Average $46,462 |
| Ghanaians | 50.3 /100 | #173 | Average $46,440 |
| Scandinavians | 50.0 /100 | #174 | Average $46,433 |
| Basques | 48.8 /100 | #175 | Average $46,399 |
| Danes | 48.6 /100 | #176 | Average $46,392 |
| Belgians | 48.0 /100 | #177 | Average $46,375 |
| Colombians | 47.1 /100 | #178 | Average $46,349 |
| English | 46.5 /100 | #179 | Average $46,334 |
| Puget Sound Salish | 46.5 /100 | #180 | Average $46,333 |
| Immigrants | Cameroon | 46.4 /100 | #181 | Average $46,329 |
| Swiss | 45.9 /100 | #182 | Average $46,315 |
| French | 45.2 /100 | #183 | Average $46,296 |
| Immigrants | Kenya | 42.4 /100 | #184 | Average $46,214 |